AUTHOR
Arkzero Research
Research Team
Arkzero Research publishes analysis on AI agents and automation.

How to Get Started with Polars for Data Analysis
Polars is a Python DataFrame library built on a Rust engine with lazy evaluation and multi-core execution. Install it with pip install polars, read CSV or Parquet files with pl.read_csv() or pl.scan_csv(), and chain filter, group-by, and aggregation expressions to analyze data. On a 1 GB CSV file with 10 million rows, Polars loads data in 1.6 seconds and uses roughly 87 percent less memory than pandas on the same task.

How to Use Julius AI for Data Analysis
Julius AI is a conversational data analysis platform that lets you upload a spreadsheet or CSV, ask questions in plain English, and receive charts, summaries, and statistical outputs in seconds with no SQL or code required. It runs Python in the background, handles messy real-world files automatically, and maintains session context so you can refine results conversationally. Free accounts are capped at 15 messages per month; real analysis work requires Plus at $35 per month or higher.

How to Set Up OpenMetadata for Data Discovery
OpenMetadata is an open-source data catalog that gives teams a single place to discover, document, and govern their data assets. Setting it up takes under 30 minutes using Docker: spin up the containers, log into the UI at localhost:8585, then connect your first data source using one of 90+ pre-built connectors. Once ingestion runs, every table, column, and owner is searchable and lineage-linked across your entire stack.
How to Build a Data Dashboard with Streamlit
Streamlit is an open-source Python library that turns a script into a shareable web dashboard without any front-end code. Install it with pip, write a Python file that loads your CSV with pandas, add sidebar widgets for filtering, and render interactive charts with Plotly. Push the file to GitHub, connect it to Streamlit Community Cloud, and anyone with the URL can view live results. No server configuration required.

How to Set Up Airbyte Cloud for Data Syncing
Airbyte Cloud is a managed data integration platform that syncs data from SaaS tools, databases, and APIs into a central warehouse without requiring Docker, infrastructure, or engineering resources. A free 30-day trial lets you connect sources like Salesforce, HubSpot, Stripe, or Google Sheets to destinations like BigQuery, Snowflake, or Postgres in minutes. This guide walks through the full setup from account creation to your first automated sync.

How to Set Up Metabase for Self-Serve Analytics
Metabase is an open-source business intelligence tool that lets non-technical teams query databases, build dashboards, and share data insights without writing SQL. You can be up and running in under 30 minutes using Metabase Cloud, or self-host it with Docker on any server. Once connected to your database, the question builder lets anyone filter, group, and visualize data through a point-and-click interface. Automated email and Slack digests replace ad-hoc reporting requests.

How to Set Up Google Looker Studio Dashboards
Google Looker Studio is a free, browser-based reporting tool that connects to over 1,400 data sources and builds interactive dashboards without SQL or coding. You sign in with a Google account, connect a source such as Google Sheets or BigQuery, drag charts onto a canvas, and share a live link or schedule PDF email delivery. As of 2026, Looker Studio Pro adds Gemini AI features including a formula assistant, conversational analytics, and automatic slide generation from any report.

How to Get Started with Wren AI
Wren AI is an open-source GenBI platform that connects to your database and lets non-technical users query it in plain English. It generates accurate SQL, charts, and answers directly in the browser. A semantic layer called MDL lets you encode business definitions once so every AI-generated query stays consistent. Setup takes about 10 minutes using Docker Compose and an OpenAI API key. Wren AI supports PostgreSQL, BigQuery, Snowflake, MySQL, ClickHouse, DuckDB, and 12 other data sources.

How to Get Started with Marimo for Data Analysis
Marimo is a reactive Python notebook that automatically reruns dependent cells when inputs or data change, eliminating the manual execution-order problem that makes Jupyter notebooks unreliable. With a built-in SQL engine powered by DuckDB, interactive UI components, and a one-command install, marimo lets analysts build reproducible, interactive data workflows in a fraction of the time traditional notebooks require. This guide covers installation, SQL queries, interactive filters, chart rendering, and app deployment.

How to Get Started with ClickHouse Cloud
ClickHouse Cloud is a managed columnar database built for analytical queries at speed. You create a free service, load data via CSV upload or the HTTP interface, and run SQL queries that return results in milliseconds even across billions of rows. This guide walks through account setup, first data load, query basics, and connecting your BI tool, without requiring any server configuration or infrastructure knowledge.
How to Set Up a Databricks Genie Space
Databricks Genie Spaces let business users query structured data in Unity Catalog using plain English, without writing SQL. An analyst configures the space once by adding tables, writing sample queries, and adding business context through a knowledge store. After setup, anyone with the right permissions can ask questions and get SQL-backed results. This guide covers the full setup process, including the knowledge store configuration steps that most tutorials skip.

How to Get Started with Count for Data Analysis
Count is a collaborative agentic analytics platform where teams can clean, model, analyze, and visualize data in one canvas using SQL, Python, and natural language. Users connect a warehouse or upload a CSV, then ask questions through a built-in AI agent backed by models from Anthropic, OpenAI, and Google. Every query and chart the agent produces is fully editable, making Count usable by both non-technical analysts and data engineers working side by side.
How to Set Up DuckDB for Local Data Analysis
DuckDB is an in-process analytical database that runs SQL queries on CSV, Parquet, and JSON files directly from your laptop, with no server to configure. Version 1.5.2, released April 13, 2026, adds DuckLake v1.0 format support and performance improvements. You install it with a single pip command and run the first SQL query on a CSV file in seconds. No cloud account, no Docker, no database administrator required.

How to Set Up Copilot in Power BI
Copilot in Power BI uses generative AI to create report pages, summarize data, and generate DAX calculations from plain-English prompts. Enabling it requires a Microsoft Fabric capacity of F64 or higher, or Premium Per User licensing tied to a capacity-backed workspace, plus a Fabric administrator toggling the feature on at the tenant level. Once configured, analysts can generate a full multi-visual report page from a single sentence.

How to Build an AI Data Analyst Chatbot with n8n
n8n is an open-source workflow automation platform with over 400 integrations. Its AI Agent node, combined with data retrieval tools and a Calculator node, lets you build a chatbot that connects to a live spreadsheet or database and answers quantitative questions in plain English. The full workflow requires no custom code, takes under an hour to set up using Google Sheets, and can be extended to Postgres or MySQL with a credential swap.
How to Use NotebookLM for Business Analysis
Google NotebookLM is a document-grounded AI assistant that draws answers only from the files you upload, citing the exact source page for every response. You can upload PDFs, reports, and business documents, then ask questions in plain English to extract key metrics, compare information across files, and generate structured data tables. The free tier supports up to 50 sources per notebook. NotebookLM Plus starts at $7.99 per month.

How to Get Started with Hex for Data Analysis
Hex is a collaborative analytics workspace that combines SQL, Python, and AI in a single browser-based environment. Teams can connect a data warehouse or upload a CSV file and start querying in minutes, with no local setup required. The Notebook Agent, which runs on Anthropic's Claude, writes and debugs code from plain-English prompts. As of early 2026, thousands of data teams use Hex daily as an alternative to standalone Jupyter notebooks.

How to Set Up Snowflake Notebooks in Workspaces
Snowflake Notebooks in Workspaces, generally available as of February 2026, replaces the original Legacy Notebooks product. The new version runs on Snowpark Container Services, supports native Git integration, and lets teams collaborate in shared workspace folders. It also introduces Notebook Project Objects, versioned units that Snowflake Tasks can schedule for automated runs. This guide walks through creating a workspace, launching a notebook, connecting to Snowflake data, and writing your first SQL and Python analysis cells.

How to Set Up Snowflake Cortex Analyst
Snowflake Cortex Analyst is a managed natural-language query layer built into the Snowflake Data Cloud that lets analysts and business users ask questions about structured data in plain English and receive SQL-generated answers without writing code. Setting it up requires a semantic model YAML file that describes your tables and business terminology, plus a Streamlit chat interface for end users. A standard setup for one or two tables takes two to three hours.
How to Get Started with Apache Spark 4.1
Apache Spark 4.1, released in December 2025, is the second major update in the 4.x series and resolved over 1,800 issues from more than 230 contributors. It introduces Spark Declarative Pipelines for defining data pipelines without managing execution graphs, a 1.5 MB pyspark-client for lightweight Spark Connect access, sub-second streaming via Real-Time Mode, and SQL Scripting enabled by default. You can install the Python client in under a minute with pip and start running queries against a local or remote Spark Connect server without configuring a JVM.

How to Get Started with Microsoft Fabric
Microsoft Fabric is Microsoft's unified analytics platform that combines data engineering, warehousing, real-time analytics, and Power BI in a single workspace. As of April 2026, Copilot is available on all paid F2-and-above SKUs, removing the previous F64 minimum requirement. Teams can ingest data from files or databases, run SQL queries, build pipelines, and create dashboards without switching tools. A free 60-day trial is available at app.fabric.microsoft.com.

How to Set Up RisingWave for Real-Time Analytics
RisingWave is a PostgreSQL-compatible streaming database that lets analysts define real-time materialized views using standard SQL. It replaces the traditional Kafka-plus-Flink streaming stack with a single system that ingests, transforms, and serves live data through any PostgreSQL client. This guide covers local installation, connecting a data source via PostgreSQL CDC or the built-in datagen connector, writing materialized views, and querying live results with zero new tooling beyond SQL you already know.

How to Get Started with Polars for Data Analysis
Polars is an open-source Python DataFrame library written in Rust that processes data 5-14x faster than pandas on most tasks. It reads CSVs roughly 5x faster and uses 87% less memory, with a multi-threaded engine that handles million-row files in seconds on a standard laptop. For analysts dealing with slow pandas notebooks or memory errors on large files, switching to Polars requires installing one package and learning a new expression-based API.

How to Set Up Ibis for Portable Python Analytics
Ibis is a portable Python analytics library that lets you write dataframe code once and run it against more than 24 backends -- including DuckDB, BigQuery, Snowflake, and Postgres -- without rewriting your analysis. Version 12.0.0, released in 2026, ships with DuckDB as a zero-config default, making it the fastest path from a local CSV file to production-grade analytical queries without touching a SQL string directly.
How to Analyze CSV Files with DuckDB
DuckDB is a free, serverless SQL database that runs on your laptop and queries CSV files directly with standard SQL. Install it in under two minutes, point it at any CSV, and run aggregation, filtering, and join queries on files that would crash Excel. There is no server to configure, no Python required, and no import step before querying. You run SQL against the raw file from the terminal.
How to Use Tableau Agent for Data Analysis
Tableau Agent is a conversational AI feature built into Tableau Desktop, Tableau Cloud, and Tableau Server (2025.3+) that lets you build visualizations, create calculated fields, and explore datasets using plain English. You type a question like "show me monthly revenue by region" and Tableau Agent generates the chart. It supports CSV, Excel, and Hyper file uploads, works with live database connections, and launched a Dashboard Narratives beta in February 2026 that summarizes insights across full dashboards. A free trial with full Tableau Agent access is available at tableau.com/products/trial.

How to Set Up Copilot in Excel for Data Analysis
Copilot in Excel requires three things before it works: a Microsoft 365 Copilot license ($30 per user per month add-on), the workbook saved to OneDrive or SharePoint, and data formatted as an Excel Table. Skip any one of those and Copilot either refuses to act or produces errors. This guide covers every setup step and shows how to run a complete analysis from a raw CSV to a finished chart using only natural language prompts.

How to Set Up Jupyter AI for Data Analysis
Jupyter AI is an open-source JupyterLab extension that connects AI models to your notebook environment. Install it with a single pip command, enter your OpenAI or Anthropic API key in settings, and use the %%ai magic command to generate analysis code, summarize results, and debug errors without leaving the notebook. This guide covers installation, model configuration, and three practical data analysis tasks you can run immediately.

What Is Golden Analytics and How to Get Started
Golden Analytics is an AI-native business intelligence platform that converts raw datasets into finished dashboards without requiring SQL knowledge or manual chart configuration. Founded by Francois Ajenstat, Tableau's former Chief Product Officer, the company launched in April 2026 with $7 million in seed funding from NEA and Madrona. Its central feature, the Slider of Autonomy, lets users control how much analysis work the AI handles versus how much they do themselves.

How to Get Started with Alteryx One
Alteryx One is a cloud analytics platform that lets operations teams and analysts build automated data workflows without writing code. Its Copilot feature generates complete, production-ready workflows from a single natural language prompt in under 90 seconds. This guide covers signing up for a workspace, connecting a data source, and running your first Copilot-driven workflow to automate a manual analysis task.

How to Get Started with Sigma Computing
Sigma Computing is a cloud analytics platform that lets analysts and business users explore live warehouse data using a familiar spreadsheet interface without writing SQL or code. Connect Sigma to Snowflake, BigQuery, Redshift, or Databricks in minutes, then build workbooks, pivot tables, and dashboards directly on top of your data warehouse. This guide walks through account setup, warehouse connection, and building your first workbook from scratch.

How to Set Up Cursor AI for Data Analysis
Cursor AI is a code editor with a built-in AI agent that lets analysts write Python and SQL without a programming background. You install it from cursor.com, open a folder containing your CSV files or database credentials, and describe what you need in plain English. The agent writes and executes code on your behalf. In a 2026 survey of 412 data analysts by LetDataSpeak, respondents using Cursor reported spending 35% less time on routine data preparation than those using traditional Python workflows.

How to Get Started with Zoho Analytics
Zoho Analytics is a self-service BI platform that lets ops teams and small business owners connect spreadsheets, CRMs, and databases and build dashboards without writing code. A first working dashboard takes under 30 minutes. After connecting a data source, users define reports through a drag-and-drop interface or by asking Ask Zia, the platform's AI assistant, questions in plain English. The Q1 2026 update added nine new connectors, Drill Actions, and agentic AI capabilities.
How to Set Up Metabase for Self-Service Analytics
Metabase is an open-source business intelligence tool that lets non-technical team members query databases and build dashboards without writing SQL. Installation takes under 30 minutes using Docker or the cloud-hosted option. You connect it to a database, ask questions with a point-and-click builder, and share live dashboards by URL. The free open-source edition supports PostgreSQL, MySQL, BigQuery, Snowflake, and more than a dozen other databases.

How to Analyze Business Data with Rows AI
Rows is a spreadsheet platform with a built-in AI Analyst that lets you clean, analyze, and visualize business data using plain-English prompts. Instead of writing formulas or SQL, you describe what you want and the AI executes it. This guide covers importing data, cleaning messy records, adding calculated columns, running analysis, building charts, and sharing results without writing code.

How to Build Data Pipelines with dlt
dlt (data load tool) is a free, open-source Python library that extracts data from APIs, databases, and cloud storage and loads it into any warehouse in minutes. Install it with pip, write a 10-line script, and your data lands in DuckDB or BigQuery automatically — with schema inference, incremental loading, and no infrastructure to manage. In January 2025 the dlt community created 2,400 pipelines per month; by January 2026 that number had grown to 81,000.

How to Get Started with Hex for Team Analytics
Hex is a cloud-based analytics workspace that combines SQL, Python, and no-code cells in a single collaborative notebook. To get started, create a free account at hex.tech, connect a data source such as Snowflake, BigQuery, or a CSV upload, open a new project, and begin querying. The Notebook Agent, launched in August 2025, generates SQL and charts from plain English prompts and speeds up analysis significantly once semantic context is configured.

How to Build Reports with Evidence.dev
Evidence is an open source framework that turns SQL queries and Markdown files into shareable, interactive data reports. You write SQL to pull your data, structure your page in Markdown, and Evidence renders everything as a fast static website you can host for free on Vercel or Netlify. The workflow takes about 20 minutes to set up and removes the need for a dedicated BI tool for most internal reporting use cases.

How to Get Started with Briefer for Data Analysis
Briefer is an open-source analytics notebook that combines SQL, Python, and dashboards in a Notion-like interface. Unlike Jupyter, it needs no local Python environment and supports real-time collaboration. Teams connect it to PostgreSQL, BigQuery, Snowflake, or CSV files, run queries, build charts, and share reports without writing infrastructure code. The cloud version is free for up to three users and takes about five minutes to configure.
How to Get Started with SQLMesh
SQLMesh is an open-source SQL transformation framework that runs data models up to 9 times faster than dbt Core. Donated to the Linux Foundation in March 2026, it works alongside or as a replacement for dbt with full backwards compatibility. Install with pip, initialize a project using a local DuckDB database, and run your first transformation in under five minutes with no external infrastructure required.

How to Set Up Great Expectations for Data Quality
Great Expectations (GX Core) is a Python library that validates data against a set of declarative rules before it reaches your pipeline or reports. Install it with pip, connect it to a CSV, SQL table, or cloud file, define Expectations describing what valid data looks like, then run a Checkpoint to validate on a schedule and receive alerts on failure. Setup takes under 15 minutes and works with pandas, SQL databases, Spark, and S3.
How to Analyze CSV Files with DuckDB
DuckDB is an open-source analytical database that runs entirely on your machine with no server setup required. Analysts can install it in under two minutes and immediately run SQL queries against local CSV, Excel, and Parquet files. Version 1.5.2, released April 2026, brought the DuckLake extension to production status. This guide covers installation, querying local files, joining datasets, filtering large files, and exporting results using DuckDB's built-in CLI.

How to Set Up Coalesce for Data Transformation
Coalesce is a visual data transformation platform that compiles SQL pipelines inside your data warehouse — Snowflake, Databricks, or Microsoft Fabric — without requiring you to write raw SQL by hand. You connect your warehouse, drag source tables onto a canvas, add stage and dimension nodes, and Coalesce generates and runs the underlying SQL. Teams using Coalesce report building production-ready pipelines in hours instead of days compared to hand-coded dbt workflows.
How to Set Up Tableau Pulse for Your Team
Tableau Pulse is an AI-powered feature in Tableau Cloud that pushes personalized metric insights to users through email and Slack digests, without requiring them to open a dashboard. Setting it up involves three main steps: enabling the feature in your site settings, publishing at least one data source to Tableau Cloud, and creating metric definitions. Once configured, any user on the site can follow metrics and receive automatic alerts when numbers shift.

How to Migrate Your Code to Pandas 3.0
Pandas 3.0, released January 21 2026, enforces copy-on-write semantics by default, switches string columns from object dtype to a dedicated str type backed by PyArrow, and requires Python 3.11 or higher. Code written for pandas 1.x or 2.x will often fail silently or raise new errors. Upgrading requires auditing chained assignments, testing string operations, and validating dtype assumptions throughout your codebase.

How to Use Power BI Copilot for Data Analysis
Power BI Copilot is Microsoft's AI layer for Power BI, built on Azure OpenAI. It lets users generate reports, write DAX formulas, and summarize dashboards using plain English prompts. To use it, your organization needs a paid Microsoft Fabric capacity (F2 or higher) or Power BI Premium (P1 or higher), and Copilot must be enabled by a Fabric admin. Once active, Copilot surfaces in the report editor, the Narrative visual, and as of April 2026, in the Power BI Mobile app.

How to Set Up Tinybird for Real-Time Analytics
Tinybird is a managed ClickHouse platform that turns raw data into queryable REST endpoints without requiring database administration experience. You create a workspace, define a data source, write SQL logic in Pipes, and publish a live API in under 30 minutes. The setup suits small teams that need sub-second query latency on streaming or batch data but lack the engineering capacity to operate ClickHouse infrastructure themselves.

How to Get Started with Amplitude Analytics
Amplitude is a product analytics platform that tracks how users interact with your app or website through events — discrete user actions like signing up, clicking a button, or completing a purchase. The free plan covers up to 50,000 monthly tracked users and bundles feature flags, session replay, and web experiments at no cost. Most teams reach their first useful funnel or retention chart within a day of connecting their product, using Autocapture if no engineer is available.

How to Get Started with dbt Canvas
dbt Canvas is a visual, drag-and-drop interface inside dbt Cloud that lets analysts build and edit data transformation models without writing SQL. Available on Team and Enterprise plans since May 2025, it works as a node-based pipeline editor: you connect source tables to transformation operators, preview output at every step, and dbt automatically generates production-grade SQL that flows into standard version control and testing pipelines, keeping governance intact.

How to Build an Operations Dashboard in Looker Studio
Looker Studio is Google's free dashboard builder that connects to Google Sheets, CSV files, BigQuery, and more than 600 data sources. To build an operations dashboard, connect your data source, set up scorecards for key metrics, add trend charts, and configure date filters. The full setup takes under an hour and requires no coding or a paid subscription.
How to Set Up Apache Superset for Analytics
Apache Superset is a free, open source business intelligence platform that lets teams explore data, build charts, and share dashboards without deep SQL expertise. Using Docker Compose, you can run a full Superset instance locally in under 15 minutes. It connects to more than 40 databases including PostgreSQL, BigQuery, and Snowflake, making it a practical alternative to paid BI tools for teams that already have data infrastructure in place.

How to Set Up AI Features in Metabase 60
Metabase 60, released in April 2026, adds AI capabilities across all plans including the free open-source version. To activate them, navigate to Admin settings, connect an Anthropic API key, select a model, and enable Metabot. Once configured, you get natural language querying, auto-generated chart summaries, an official MCP server for Claude and VS Code, and Metabot in Slack. The setup takes under ten minutes and requires no paid Metabase tier.

How to Get Started with Microsoft Fabric (2026)
Microsoft Fabric is Microsoft's unified analytics platform that combines data pipelines, lakehouses, notebooks, and Power BI reporting in a single SaaS product. As of 2026, any Microsoft account holder can start a free 60-day trial at app.fabric.microsoft.com without IT involvement. This guide walks through creating a workspace, uploading data, running a SQL query, and using Copilot to generate reports without writing code.

How to Set Up DuckLake for Local Analytics
DuckLake is a lakehouse format released to production in April 2026 that stores all metadata in a SQL database instead of scattered JSON files on object storage. Unlike Delta Lake or Apache Iceberg, it runs on a local SQLite or PostgreSQL catalog with no separate catalog server required. You can spin up a production-ready lakehouse in under five minutes using the ducklake extension for DuckDB v1.5.2, with ACID transactions, time travel, and schema evolution included out of the box.

How to Set Up Claude in Excel (2026 Guide)
Claude for Excel is an official Anthropic add-in that brings Claude directly into Microsoft Excel as a persistent sidebar. Available to Pro, Max, Team, and Enterprise Claude subscribers, it installs in under two minutes through the Microsoft Office Add-ins store. Users can analyze data, write formulas, clean datasets, and build reports using plain-English prompts from inside any Excel workbook. As of March 2026, the add-in also supports Shared Context with PowerPoint, carrying spreadsheet analysis into slide generation without manual copying.
How to Get Started with Mixpanel for Product Analytics
Mixpanel is an event-based product analytics platform that tracks user actions — signups, feature clicks, purchases — and turns them into funnels, retention charts, and cohort reports. Getting started requires three steps: mapping your event taxonomy before touching code, installing the SDK or connecting via Segment, and building your first three core reports. Teams that follow this sequence typically surface their first actionable retention insight within five to seven days of setup.

How to Analyze Graph Data with BigQuery Graph
BigQuery Graph, released in preview in April 2026, lets you model and query relationships in your existing BigQuery data using Graph Query Language (GQL) without moving or copying any data. You define nodes and edges as logical views over your tables, then write GQL pattern-matching queries directly in BigQuery Studio. This guide walks through creating a property graph, writing your first GQL query, and visualizing results for common use cases like fraud detection and supply chain tracing.

How to Use the =AI() Function in Google Sheets
Google Sheets includes a native =AI() function, powered by Gemini, that lets you run text generation, summarization, and categorization directly inside spreadsheet cells. You write a plain-English instruction in the formula, reference a cell range, and Gemini processes each row automatically. The function requires a Google Workspace Business Standard plan or higher and is currently available in the US only.

How to Get Started with Copilot in Power BI
Copilot in Power BI lets business users ask questions about their reports in plain English, generate new report pages from a description, and get instant summaries without writing a single formula. To use it, your organization needs a paid Fabric capacity (F2 or higher) or Power BI Premium (P1 or higher). This guide covers what Copilot can do, how to confirm your setup, and how to get useful results from day one.

How to Set Up ClickHouse Cloud for Analytics
ClickHouse Cloud is a managed deployment of the open-source ClickHouse columnar database, built for fast analytical queries on large datasets. You can create a free account, upload a CSV file, and run sub-second SQL aggregations without managing any infrastructure. This guide covers account setup, table creation, data loading from CSV and remote sources, running aggregation queries, and connecting a BI tool to your ClickHouse service.

How to Query S3 Files with Amazon Athena
Amazon Athena lets you run SQL directly on files stored in S3 with no database to set up or maintain. You point Athena at a bucket, define a table schema in the AWS Glue Data Catalog, and start querying CSV, JSON, or Parquet files within minutes. Athena charges $5 per terabyte scanned, so converting raw CSV to Parquet before querying can cut costs by 60 to 80 percent on the same workload.

How to Set Up Data Quality Checks with Soda
Soda is an open-source data quality platform that scans databases, warehouses, and CSV files using a YAML-based language called SodaCL. Install the library with a connector for your data source, write a checks file defining row count, freshness, and validity rules, then run soda scan from your terminal. As of February 2026, the library ships an AI agent called soda ai that generates checks automatically from your table schema or dbt models.

How to Get Started with Polars for Data Analysis
Polars is a Python DataFrame library built in Rust that runs queries in parallel across all CPU cores, making it 5 to 50 times faster than pandas on datasets above a few hundred thousand rows. Install with pip install polars, load a CSV with pl.read_csv(), and write expressions using .select(), .filter(), and .group_by(). Unlike pandas, Polars has no row index and supports lazy evaluation via .lazy() and .collect() for large file processing.

How to Set Up Cube for Agentic Analytics
Cube is an open-source semantic layer that sits between your database and your BI tools, defining metrics once so every query and AI agent uses the same numbers. You can run Cube locally with Docker in under ten minutes, connect it to a Postgres or warehouse database, generate a data model automatically, and query it in plain English using Cube's D3 agentic analytics layer. This guide walks through the complete setup from scratch.
How to Get Started with Tableau Agent
Tableau Agent is a generative AI assistant built into Tableau Desktop, Tableau Cloud, and Tableau Server (version 2025.3 and later) that lets analysts explore data, build visualizations, and generate calculations using plain-English prompts. Enabling it requires a Tableau+ license on Desktop or administrator-enabled AI features on a Tableau Cloud site. Once active, you access the Agent icon in the toolbar and describe what you want in natural language.

How to Get Started with Hex for Data Analysis
Hex is a collaborative analytics platform where you connect a database or upload a CSV, write SQL or Python in a notebook, and publish results as a shareable interactive app. The AI Notebook Agent takes plain-English descriptions of what you want to analyze and writes the query logic for you. Setup takes under 10 minutes, and a free workspace is available at app.hex.tech.

How to Get Started with Deepnote for Data Analysis
Deepnote is a collaborative analytics notebook that combines Python, SQL, and AI in a single browser-based workspace. Users can connect a live database or upload a CSV, generate queries in plain English using the built-in AI block generator, and share live notebooks with teammates without installing anything locally. The free tier supports up to 3 editors and 5 projects; the Team plan costs $59 per editor per month.
How to Set Up Metabase for Business Data Analysis
Metabase is an open-source business intelligence tool that lets non-technical teams query databases and build dashboards without writing SQL. You install it via Docker or the cloud option, connect it to your database, and use the visual query builder to answer business questions in minutes. More than 50,000 organizations use Metabase to give ops, sales, and finance teams self-service access to their data.
How to Analyze CSV Files with DuckDB
DuckDB is a free, open-source analytical database that runs entirely in-process with no server required. It lets analysts query CSV, Parquet, and JSON files directly with standard SQL in seconds. Version 1.5.2, released April 13, 2026, brings min and max query speedups of 6 to 18 times over prior releases. This guide walks through installation, first queries on CSV files, aggregations, multi-file joins, and exporting results.

How to Use AI in Google Sheets for Data Analysis
Google Sheets includes three native AI tools as of 2026: the =AI() formula for cell-level operations, the Gemini sidebar for conversational dataset questions, and natural language formula generation. All three require a qualifying Google Workspace plan. The =AI() formula can categorize, summarize, or sentiment-score hundreds of rows in minutes by dragging one formula down a column. The Gemini sidebar answers questions about your full spreadsheet but returns text only and cannot generate charts or cross-reference separate tabs.

How to Get Started with MindsDB Anton
MindsDB Anton is an open-source autonomous BI agent that connects to your databases, CSVs, or APIs and answers analytical questions by writing and executing its own SQL and Python code. Released in April 2026, Anton runs locally on your machine and delivers complete outputs including charts, tables, and dashboards from a single plain-language prompt. This guide covers installation, LLM provider setup, connecting a data source, and running your first analysis.

How to Set Up Databricks AI/BI Genie
Databricks AI/BI Genie is a natural-language analytics interface for Databricks workspaces that converts plain-English questions into SQL queries and returns results instantly. Setting it up involves creating a Genie space connected to Unity Catalog tables, building a knowledge store with column descriptions and join relationships, adding example SQL queries for common questions, and sharing the space with business users who need self-service access to data.

How to Build a Dashboard with Observable Framework
Observable Framework is a free, open-source static site generator for building data dashboards. You process data in Python, SQL, or R at build time, and the framework compiles the results into a fast static site with no server required. This guide covers creating a project, writing a Python data loader to connect a live data source, building charts with Observable Plot, and deploying to GitHub Pages with automatic daily refreshes.

How to Set Up DuckLake for Your Data Lake
DuckLake is an open table format released in April 2026 that stores lakehouse metadata in a SQL database instead of thousands of JSON and Avro files. To set it up, install the ducklake DuckDB extension, attach a local catalog file for testing, then swap to PostgreSQL and S3 for production. The result is a multi-user, ACID-compliant data lake with time travel and branching, running on infrastructure most teams already have.

How to Build Dashboards with Rill Developer
Rill Developer is a free, open-source BI tool that turns CSV files, Parquet files, or cloud data sources into interactive dashboards without requiring a database server or SQL expertise. You install it with one command, point it at your data, and use its built-in AI to generate a metrics view and Explore dashboard in under five minutes. Rill runs locally using DuckDB as its embedded engine, meaning there is nothing to configure or host before you start.

How to Set Up Notion Dashboard Views
Notion Dashboard Views, released in March 2026, let you add charts, KPI cards, and progress bars directly on top of any Notion database. You add a Dashboard view to an existing database, choose which properties to visualize, and arrange widgets on a free-form canvas. Notion AI can suggest chart types from your property names and types automatically. Setup takes under 15 minutes. No external BI tool is required.

How to Get Started with ThoughtSpot
ThoughtSpot is a cloud-based analytics platform that lets you query any connected data warehouse using plain English, without writing SQL. To get started, sign up for a free trial at thoughtspot.com, connect a data source (CSV, Google Sheets, or a cloud warehouse like Snowflake or BigQuery), and use Spotter AI to ask questions in natural language. Setup takes under 30 minutes and requires no SQL or coding knowledge.
How to Get Started with Hex AI Analytics
Hex is a collaborative analytics platform that combines SQL notebooks, Python, and a drag-and-drop app builder in a single browser-based workspace. Its Notebook Agent, built on Claude Sonnet 4, generates queries, builds charts, and drafts full analyses from plain-English prompts. Teams connect directly to warehouses like Snowflake and BigQuery or upload CSV files, then publish finished notebooks as shareable interactive apps without writing deployment code.

How to Analyze CSV Data with AI
Analyzing a CSV file with AI means uploading the file to a platform, describing your question in plain English, and letting the tool handle column detection, data cleaning, statistical method selection, and chart generation automatically. No Python or SQL is required. Most AI CSV tools return labeled charts and written summaries within seconds, and support analysis types including correlation, regression, clustering, and time-series forecasting.

How to Analyze Data Faster with Polars
Polars is a Python DataFrame library written in Rust that reads and processes tabular data 5 to 10 times faster than pandas on datasets over 100MB. It installs with a single pip command, accepts the same CSV and Parquet files you already work with, and handles filtering, grouping, and aggregation with a clear expression syntax. Analysts migrating from pandas can run most everyday tasks with minimal changes to their existing workflow.

How to Set Up Copilot in Power BI
Copilot in Power BI is Microsoft's generative AI assistant that creates report pages, writes DAX formulas, and produces natural-language summaries from your data using plain English prompts. As of 2025, Copilot is available on any Microsoft Fabric capacity at F2 or above, or Power BI Premium at P1 or above. This guide walks through enabling Copilot at the tenant and workspace level, then covers the practical prompts that produce reliable output for analysts, ops managers, and business users who do not write code.
How to Get Started with Apache Superset
Apache Superset is an open-source business intelligence platform that lets analysts and operations managers build interactive dashboards and explore data without writing code. Released as version 6.0 in December 2025, it connects to dozens of databases including PostgreSQL, MySQL, BigQuery, and Snowflake. You install it locally with Docker Compose, connect a data source, and start building charts in under 30 minutes. Over 1,000 organizations run Superset in production, from startups to large enterprises.

How to Get Started with Mage AI
Mage AI is an open-source data pipeline orchestration tool that lets you build, run, and monitor ETL workflows through a visual notebook interface. Unlike heavier tools such as Apache Airflow, Mage runs locally via Docker with no configuration overhead, and pipelines are built from modular blocks in Python or SQL. Most teams can have a working pipeline loading, transforming, and exporting data within 30 minutes of installation.

How to Analyze Data with PandasAI
PandasAI is a Python library that lets you query your data in plain English instead of writing code. You point it at a CSV file, SQL database, or pandas DataFrame, ask a question like "what was the top product by revenue last quarter?", and it generates and runs the analysis for you, returning the result or a chart. Setup requires Python 3.8 or later and an OpenAI API key, and takes about 10 minutes.

How to Get Started with Quadratic AI Spreadsheet
Quadratic is an AI-powered spreadsheet that runs in the browser and lets you write Python, SQL, or plain English to analyze data without switching tools. You connect a CSV or database, type what you want to find, and Quadratic returns the result directly in the grid. It is built for analysts and ops teams who need more than formulas but do not want to manage a full data stack.

How to Get Started with Prefect 3
Prefect 3 is a Python-native workflow orchestration framework that turns decorated Python functions into scheduled, retryable, observable data pipelines. Installing it takes one command (pip install prefect), and a working scheduled flow requires fewer than 20 lines of code. Prefect Cloud's free tier supports up to 500 flow runs per month with no credit card required, making it the fastest path from a manual Python script to a production-grade pipeline.
How to Set Up Lightdash with dbt
Lightdash is an open-source BI tool that connects directly to a dbt project and turns your existing model YAML into an explorable analytics layer. To set it up, install Lightdash via Docker Compose, point it at your dbt project and data warehouse, and add field definitions to your model YAML files. Lightdash generates dimensions and metrics automatically. The full process takes under an hour and gives business users self-serve analytics without writing SQL.

How to Get Started with Marimo Notebook
Marimo is an open-source Python notebook that stores code as plain .py files and runs cells reactively. When one cell changes, all dependent cells update automatically. Unlike Jupyter, marimo notebooks are version-control friendly, executable as scripts, and deployable as interactive apps without a separate server. Install with pip install marimo, create a notebook with marimo edit, and use built-in SQL cells to query dataframes directly from the editor.

How to Use Agent Mode in Excel with Copilot
Agent Mode in Microsoft Excel Copilot, generally available since March 2026, lets users give outcome-based instructions in plain English and have Copilot autonomously plan steps, write formulas, clean data, and build outputs directly in the workbook. It requires a Microsoft 365 Personal, Family, Premium, or commercial Copilot license, and the workbook must be saved to OneDrive or SharePoint. The older Think Deeper and App Skills features were deprecated in February 2026 and are no longer available for most users.
How to Get Started with dbt Cloud
dbt Cloud is a managed web platform for running dbt (data build tool), the open-source framework used by data teams to write, test, and schedule SQL-based transformation models. Unlike dbt Core, which requires a local Python environment and command-line setup, dbt Cloud runs entirely in the browser and connects directly to a cloud data warehouse. A team with an existing warehouse can sign up and run their first transformation model in under 30 minutes.

How to Get Started with Amazon QuickSight
Amazon QuickSight is AWS's cloud-native business intelligence service. To get started, create an AWS account, sign up for QuickSight (Standard for basic dashboards, Enterprise for Amazon Q natural language features), connect a data source such as S3 via Athena or a direct CSV upload, build a dataset, and create an analysis. The full setup takes under 30 minutes for most data sources and requires no SQL knowledge for basic dashboards.

How to Set Up Wren AI for Natural Language SQL
Wren AI is an open-source tool that connects to PostgreSQL, BigQuery, Snowflake, MySQL, and 8 other databases and lets you query them in plain English. Unlike tools that pass raw schema directly to an LLM, Wren AI uses a semantic layer where you define table relationships and column meanings once, producing consistent SQL across every question. Setup takes roughly 30 minutes: install via Docker, connect your database, define relationships, add column descriptions, then start asking questions.

How to Build Automated Data Workflows with n8n
n8n is an open-source workflow automation platform that connects databases, spreadsheets, and APIs through a visual node editor. You pull data from sources like Postgres or Google Sheets, apply transforms and aggregations, and push the results to Slack, email, or a dashboard on a schedule. Teams report eliminating 3 to 5 hours of weekly manual report assembly after building a single n8n workflow.

How to Get Started with Tableau Pulse
Tableau Pulse is Tableau Cloud's AI-powered metrics layer that surfaces personalized KPI insights in plain language, delivered via email and Slack digests without requiring anyone to open a dashboard. Setup takes three steps: enable Pulse at the site level, create a metric definition from a published data source, and configure which users follow which metrics. Teams can have their first metric live in under an hour.

How to Use Gemini in BigQuery (2026 Guide)
Gemini in BigQuery is Google's AI assistant that lets analysts ask questions about their data in plain English, without writing SQL. Enable it through the Google Cloud console, open BigQuery Studio, and type your question into the chat panel. Gemini translates your question into SQL, runs it, and returns results with an explanation. The Data Insights feature generates suggested questions automatically from any unfamiliar table in minutes.

How to Get Started with Sigma Computing
Sigma Computing is a cloud analytics platform that lets business users work with warehouse data through a familiar spreadsheet interface, with no SQL required. It connects directly to Snowflake, BigQuery, or Databricks and queries live data in real time - no CSV exports, no stale snapshots. A non-technical analyst can go from connecting a data source to publishing a live dashboard in under 30 minutes.

How to Get Started with Omni Analytics
Omni Analytics is a modern business intelligence platform that connects directly to your database or cloud warehouse and lets business users build analyses and dashboards without writing SQL. The setup takes under 30 minutes: connect a data source, explore data in a workbook using point-and-click or SQL, then publish a shareable dashboard. A natural language query layer added in 2025 lets users ask questions in plain English against their live, governed data model.

How to Set Up the Hex AI Agent (2026 Guide)
Hex is a collaborative analytics platform that combines SQL, Python, and AI agents in a single workspace. Getting useful results from the Hex Agent requires four setup steps before asking a question: a scoped data connection, endorsed tables, column descriptions, and a workspace context file. With those configured, the agent generates accurate SQL, surfaces charts from existing projects, and since the April 2026 update, builds a persistent user memory that improves responses over time.
How to Get Started with Dagster
Dagster is an open-source data orchestration platform that models pipelines as software-defined assets rather than task graphs. To get started, install it with pip, define assets as plain Python functions decorated with @asset, and run dagster dev to launch a local UI. Unlike Airflow, Dagster tracks the freshness of each data asset it produces, making lineage and staleness visible at a glance. A working pipeline with a daily schedule takes under 20 minutes to set up from scratch.

How to Set Up Snowflake Cortex Analyst
Snowflake Cortex Analyst lets analysts and business users ask plain-English questions about their warehouse data and get SQL-generated answers instantly. Setup requires a Snowflake account, a semantic model YAML file that maps your tables into business terms, and either a Streamlit interface or the Cortex REST API. This guide walks through each step from environment prep to running your first natural language query.

How to Get Started with Kestra
Kestra is an open-source, YAML-based workflow orchestrator that lets ops managers and analysts automate data pipelines without writing Python code. You install it with a single Docker command, define tasks in a plain-text YAML file, and trigger them on a schedule or from an event like a file upload. Most teams have their first automated pipeline running within an hour of installation.

How to Get Started with Microsoft Fabric
Microsoft Fabric is a unified analytics platform that consolidates data ingestion, storage, transformation, and reporting into a single Microsoft-hosted workspace. It replaces the need to separately manage Azure Data Factory, Azure Synapse Analytics, and Power BI by centralizing them under OneLake, a single logical data store. Teams that already use Power BI or Microsoft 365 can activate Fabric through a 60-day free trial at app.fabric.microsoft.com without provisioning separate Azure resources.
How to Set Up Fivetran to Sync Data to Your Warehouse
Fivetran is a managed ELT service that moves data from over 500 sources into a central warehouse automatically. You connect a source, pick a destination, and Fivetran handles schema detection, syncing, and ongoing maintenance without code. The setup takes under 30 minutes for most connectors. This guide walks through account creation, destination configuration, connector setup, and first sync verification.

How to Set Up ChatGPT for Excel (2026 Add-In)
OpenAI launched ChatGPT for Excel on March 5, 2026, as a native add-in powered by GPT-5.4. It installs directly into Excel and lets users build formulas, analyze data, and update models through plain-English prompts. The add-in is available to ChatGPT Pro, Plus, Business, Enterprise, Edu, and teacher accounts. It does not yet support VBA macros, Power Query, or Pivot Table modifications.

What to Do After Apache Airflow 2 End of Life
Apache Airflow 2 reached end of life on April 22, 2026, ending all security patches and bug fixes for the 2.x line. Teams running Airflow 2 now face two paths: upgrade to Airflow 3, which introduces breaking changes across existing DAGs, or migrate to an alternative orchestrator like Kestra or Prefect. The right choice depends on team size, Python expertise, and how urgently compliance deadlines apply.
How to Get Started with Apache Iceberg Using DuckDB
Apache Iceberg is an open table format that adds ACID transactions, schema evolution, and time travel to files stored on object storage or local disk. DuckDB's Iceberg extension lets analysts query and write Iceberg tables with a single pip install and no Spark cluster required. This guide walks through installing the extension, creating your first table, running queries, and understanding the v3 features that changed how deletions and semi-structured data are handled.

How to Get Started with MotherDuck
MotherDuck is a serverless cloud data warehouse built on DuckDB. You connect with one line of Python, get 10 GB free with no credit card, and the query planner routes each operation between your laptop and the cloud based on where data lives. Teams use it to share live databases without exporting files and to query S3 directly in SQL.

How to Get Started with SQLMesh
SQLMesh is an open-source data transformation framework built as a faster, more reliable alternative to dbt. It introduces a plan-based workflow that shows exactly what SQL models will run and what data will change before any transformation executes. To get started, install it with pip, run sqlmesh init duckdb in a new directory, then run sqlmesh plan to preview your first environment. The whole setup takes under ten minutes on any machine with Python.

How to Set Up Hightouch for Reverse ETL
Hightouch is a reverse ETL platform that reads data from your data warehouse or database and syncs it to downstream business tools like Salesforce, HubSpot, Braze, and Google Ads. Unlike forward ETL, which moves raw data into a warehouse, reverse ETL pushes transformed, model-ready data back into the tools your sales, marketing, and ops teams actually use. Setup takes about 30 minutes for a basic source-to-destination sync.

How to Get Started with Polars for Data Analysis
Polars is a DataFrame library written in Rust that processes tabular data 10 to 30 times faster than pandas for most operations. To get started, install it with pip install polars, load a CSV with pl.read_csv(), and use its expression-based API to filter, group, and aggregate data. Polars handles large files that cause pandas to slow or crash, with no extra configuration needed, making it a practical step up for analysts who regularly hit pandas performance limits.

How to Set Up Grafana for Business KPI Monitoring
Grafana is an open-source analytics platform used by more than 20 million people worldwide, best known for infrastructure monitoring but equally capable of tracking business KPIs. By connecting Grafana Cloud to a PostgreSQL or MySQL database and writing a few SQL queries, operations managers and analysts can build live dashboards for revenue, conversion rates, and churn without installing any server software. The free tier supports up to three active users and is enough to cover most small-team reporting needs.

How to Build an Internal Dashboard with Retool
Retool is a low-code platform that lets you connect a database, API, or Google Sheets and build a working internal dashboard in under 30 minutes. You create queries against your data source, drop charts and tables onto a canvas, and share the result with your team via a URL. No backend code is required. Retool supports PostgreSQL, MySQL, Supabase, REST APIs, Google Sheets, and more than 50 other data sources out of the box.

How to Connect Your Database to Claude with MCP
Model Context Protocol (MCP) connects a PostgreSQL, MySQL, or SQLite database directly to Claude so you can query it in plain English without writing SQL. Setup takes under 10 minutes: install a lightweight MCP server, add a connection string to Claude Desktop's configuration file, and Claude reads your live schema automatically. By March 2026, over 10,000 MCP servers existed across public registries, making this the fastest path to AI-powered database analysis without custom code.

How to Query Your Database with Vanna AI
Vanna AI is an open-source text-to-SQL framework that translates plain-English questions into SQL queries against your database. After connecting to PostgreSQL, SQLite, Snowflake, or another supported database and training Vanna on your schema with example question-to-SQL pairs, anyone on your team can get answers without writing SQL. Vanna 2.0, released in early 2026, adds a built-in web interface suited for team deployment and streaming responses.

How to Use Airtable AI for Data Analysis
Airtable's built-in AI features let you classify, summarize, and extract insights from structured data without writing formulas or SQL. Using the AI field, categorization templates, and the Omni assistant, non-technical teams can turn raw records into analysis-ready tables in minutes. The workflow covers CRM data, customer feedback, survey results, or any table with more than a few hundred rows. No plugins or external tools are required.

How to Build Data Reports with Evidence.dev
Evidence.dev is an open-source framework that lets analysts build published data reports by writing SQL queries inside Markdown files. Instead of configuring a drag-and-drop BI tool, you define queries in code and Evidence renders them as a live website with charts and tables. Setup takes under 30 minutes for a CSV-based project. Evidence supports DuckDB, PostgreSQL, BigQuery, Snowflake, and flat files, producing a static site deployable to Netlify, Vercel, or GitHub Pages with full Git version control.

How to Automate Weekly Data Reports with Make
Make is a no-code automation platform that lets ops managers and founders build scheduled data pipelines without writing code. To automate a weekly report, you create a scenario with a schedule trigger, pull data from sources like Google Sheets, Airtable, or a CRM, use a text aggregator to format the output, then route it to email or Slack. Setup takes under 30 minutes and runs reliably on its own after that.

How to Sync Your SaaS Data with Airbyte Cloud
Airbyte Cloud is a managed data integration service that connects SaaS tools like HubSpot, Stripe, and Google Sheets to a data destination such as BigQuery or PostgreSQL, with no server setup required. The cloud version handles authentication, scheduling, and incremental syncs through a point-and-click interface. A first sync can be running in under 30 minutes without writing any code.

How to Build a Data Dashboard with Streamlit
Streamlit is an open-source Python framework that converts a script into a shareable web dashboard in minutes. Version 1.55.0, released March 2026, added URL state binding so dashboard filters become bookmarkable links. You install Streamlit with pip, write a script using st.dataframe, st.selectbox, and st.line_chart, then deploy free to Streamlit Community Cloud from a GitHub repository. No frontend skills are required.

How to Sync Live Data to Google Sheets with Coefficient
Coefficient is a Google Sheets and Excel add-on that pulls live data from 100+ business systems directly into spreadsheets with no coding required. After installing the add-on, you connect a data source such as PostgreSQL, Salesforce, or Snowflake, run an import to load records into a sheet, and schedule automatic refreshes hourly or daily. The result is a spreadsheet that always reflects current data without manual exports or copy-paste.

How to Query CSV Files with DuckDB (No Setup Needed)
DuckDB is a free, open-source analytical database that runs entirely on your laptop with no server or configuration required. To query a CSV file, download a single executable, open it, and type a SQL statement — DuckDB reads the file directly and infers column types automatically. It processes large files three to ten times faster than Pandas. For analysts and operations teams dealing with regular data exports, this removes the usual friction between receiving a file and extracting a usable answer.
How to Set Up Hex Notebook Agent for Analytics
Hex is a collaborative analytics platform that combines SQL, Python, and no-code cells in a shared notebook. Its Notebook Agent, launched in 2025 and updated through 2026, lets analysts prompt in plain English to generate queries, write code, and build visualizations directly inside a project. Setting it up takes under 10 minutes: create a free account, connect a data source, open a notebook, and activate the Agent from the sidebar.

How to Analyze Open-Ended Survey Responses with AI
Analyzing open-ended survey responses manually takes a trained analyst 4 to 6 hours per 100 responses. AI tools cut that to minutes by automating theme extraction, sentiment scoring, and frequency counts. The most reliable approach exports responses to a CSV, then feeds them to an AI tool with a structured prompt specifying categories and output format. This guide covers the full process, from data export to actionable summary, using tools available today without writing code.
How to Set Up Apache Superset with Docker
Apache Superset is a free, open-source business intelligence platform that lets teams build interactive dashboards and explore data without writing application code. The fastest way to get it running is with Docker Compose, which sets up the full stack including a metadata database, cache layer, and background workers in a single command. This guide covers the complete setup process, how to connect a real data source, and the first steps to building a working dashboard.

How to Set Up dbt Core: A Beginner's Guide
To set up dbt Core, install the adapter for your data warehouse with pip, configure a profiles.yml file with your connection credentials, run dbt init to scaffold a project folder, then write SQL SELECT statements in the models/ directory and execute dbt run to materialize them. dbt Core 1.11.6 is the current stable release as of April 2026. The full setup takes under 30 minutes for most warehouse connections.

How to Set Up Databricks AI/BI Genie
Databricks AI/BI Genie is a natural language query interface that lets analysts and business users ask questions about their data in plain English and get SQL-backed answers without writing code. Setting it up requires data registered in Unity Catalog, a Pro or Serverless SQL warehouse, and a configured Genie space with a curated knowledge store. Teams that complete the full setup typically replace dozens of ad hoc data requests each month with self-service queries.

How to Get Started with Sigma Computing
Sigma Computing is a cloud-based analytics platform that connects directly to your data warehouse and lets you analyze data using a familiar spreadsheet interface. Unlike traditional BI tools that require SQL or Python, Sigma lets analysts and operations managers query live warehouse data, run AI-powered analysis, and build dashboards without writing code or extracting data to local files. The platform reached $100 million in annual recurring revenue in April 2025.
How to Get Started with Polars in Python
Polars is a Python DataFrame library written in Rust that processes data 3 to 14 times faster than pandas depending on the operation. It uses Apache Arrow's columnar memory format and a lazy evaluation engine that optimizes queries before running them. Install it with one pip command; Polars reads CSV, Parquet, and JSON files directly, and covers filtering, groupby, joins, and aggregation with the same analytical workflow pandas users already know.

How to Analyze CSV Files with DuckDB
DuckDB is a free, zero-configuration SQL database that reads CSV files directly without any import step. Download the single CLI binary, run duckdb from your terminal, and query any CSV file with standard SQL immediately. No Python, no database server, and no schema definition are required. DuckDB detects column types automatically, supports aggregations and joins across multiple files, and handles datasets from a few rows to several gigabytes on a standard laptop.
How to Set Up Metabase Metabot AI
Metabase Metabot AI is an AI assistant built into the Metabase analytics platform that lets users query databases in plain English without writing SQL. Setting it up requires connecting a database, enabling Metabot with an Anthropic API key, and adding table and column descriptions to improve answer quality. The full process takes under 30 minutes for both self-hosted and Metabase Cloud deployments.

How to Analyze Data with Claude AI
Claude AI can analyze CSV and Excel files directly from the chat interface without any setup, database configuration, or coding. Upload a file, describe what you need in plain English, and Claude returns calculations, summaries, and charts in seconds. Its 200,000-token context window handles roughly 150,000 rows of business data in a single session, making it one of the few AI tools where a complete year of sales or operations data fits in one conversation without truncation.

How to Use Gemini AI in Google Sheets
Gemini AI in Google Sheets gives analysts three distinct tools: a conversational sidebar for ad hoc dataset questions, an =AI() cell formula for row-level classification and extraction, and Connected Sheets for natural-language queries against BigQuery at scale. Each feature requires a Google Workspace Business Standard plan or higher. The sidebar handles trend spotting and chart generation; the =AI() function processes thousands of rows without writing formulas manually; Connected Sheets queries billions of rows from BigQuery without importing data.

How to Set Up Microsoft Fabric for Data Analysis
Microsoft Fabric is a unified analytics platform that combines data ingestion, storage, transformation, and reporting into a single workspace. To set it up for data analysis, start a 60-day free trial at app.fabric.microsoft.com using a work or school Microsoft account, create a workspace assigned to trial capacity, build a lakehouse to store your data, and connect Power BI for reporting. AI features like Copilot and Data Agent require a paid F64 or higher capacity.
How to Set Up ChatGPT for Excel
ChatGPT for Excel is a native Office Add-in launched in March 2026 that lets you build financial models, run scenario analysis, and explain formulas using plain-language prompts. It requires ChatGPT Plus ($20/month) or higher and an active Microsoft 365 subscription. Available in the US, Canada, and Australia, setup takes under five minutes through the Excel Add-ins store, though performance on complex models varies.

How to Get Started with Golden Analytics
Golden Analytics is a new AI-native business intelligence platform that launched in April 2026 with $7 million in seed funding. Built by former Tableau CPO Francois Ajenstat, it lets analysts go from a raw CSV to a shareable dashboard without manual configuration. The platform's defining feature, the Slider of Autonomy, lets users choose how much work the AI does. Early access sign-up is open at goldenanalytics.com.

How to Build Reports with Power BI Copilot
Power BI Copilot lets analysts and business users build complete report pages from plain English prompts, without writing DAX or configuring visuals manually. It works within Power BI service and Desktop, requires a paid Fabric capacity (F2 or higher), and performs best when the underlying semantic model has clean column names and field descriptions. Copilot handles chart selection, layout, and narrative summaries, but accurate output depends heavily on how well the data model is prepared before use.

How to Use Julius AI for Data Analysis
Julius AI is a browser-based data analysis tool that accepts CSV, Excel, PDF, and other file formats and answers questions about your data in plain English. Users upload a file, type a question, and receive charts, statistical summaries, or cleaned datasets within seconds. The platform supports regression, t-tests, ANOVA, and custom visualizations without any coding. A free tier offers 15 messages per month; the Pro plan costs $37 per month billed annually.

How to Use Hex Notebook Agent for Analysis
Hex's Notebook Agent lets analysts run SQL queries, generate Python code, and build charts from plain English prompts inside a shared notebook. Available in beta on all Hex paid plans since August 2025, it connects directly to your data warehouse, understands your schema, and can create cells across multiple types without manual coding. This guide walks through setup, effective prompting, and a real analysis workflow from start to finish.
How to Set Up Airtable AI for Structured Data
Airtable's "Generate structured data" automation action lets you define an output schema so AI extracts consistent, typed fields from unstructured text, PDFs, or form submissions. This tutorial walks through creating the automation trigger, configuring the JSON schema, mapping outputs to Airtable fields, and testing the pipeline. All Airtable plans include AI credits, starting at 500 per month on Free.
How to Analyze CSV Files with DuckDB
DuckDB is an in-process SQL database that lets you query CSV files directly with standard SQL, without installing a database server or loading data into a separate tool. You can run it from the command line or inside a Python script, and it handles files of several gigabytes without significant setup. This guide walks through installing DuckDB, querying CSVs, running aggregations and window functions, and exporting results, covering the steps that most beginner tutorials skip.

How to Use Google Colab Data Science Agent
Google Colab's Data Science Agent is a free Gemini-powered tool that generates complete Python notebooks from a plain-English prompt and an uploaded CSV. You describe what you want to analyze, the agent writes the code, runs it, and returns charts and statistical summaries. It works best with structured tabular data and clear analysis goals. As of April 2026, it is available to all Colab users age 18 and older in supported regions.

How to Set Up Sigma Computing AI Query
Sigma Computing AI Query lets you call warehouse AI models directly from a spreadsheet formula bar, returning classifications, translations, summaries, and sentiment scores into new columns without writing Python or moving data. You connect your Snowflake, Databricks, or BigQuery warehouse, enable AI functions, then use passthrough formulas like CallText to run models on live data. Sigma crossed $200M ARR in April 2026, with AI Query among its fastest-adopted features.

How to Create Interactive Charts with Datawrapper
Datawrapper is a free, browser-based tool that turns raw data into interactive charts, maps, and tables in four steps without writing any code. You paste or upload your data, pick a chart type, customize colors and labels, then publish an embed link or PNG export. Over 40,000 organizations use it, including Reuters, the BBC, and the UN. This tutorial walks through each step with practical examples for business reporting.

How to Set Up Datadog Experiments for A/B Testing
Datadog Experiments is a new product that lets teams run A/B tests inside the Datadog platform, connecting product changes directly to business metrics stored in their data warehouse. It launched in general availability on April 2, 2026, built on technology from Datadog's acquisition of Eppo. This guide walks through the full setup process, from configuring data sources to launching your first experiment with feature flags and guardrail metrics.

How to Set Up Power BI Copilot for AI Reports
Power BI Copilot uses Microsoft Fabric's generative AI to help analysts build reports, write DAX formulas, and summarize datasets through natural language prompts. Activating it requires Fabric capacity at F64 or higher, or a Premium Per User license at $20 per month per user. Once a Fabric administrator enables the Copilot tenant setting in the admin portal, the feature becomes available in both Power BI Desktop and the Power BI web service for all licensed users.

How to Analyze Large CSV Files with DuckDB
DuckDB is a free, open-source analytical database that lets you query CSV files directly with SQL, no server or setup required. Install it with a single command, point it at any CSV (even files with hundreds of millions of rows), and run aggregations, filters, and joins in seconds on a standard laptop. This guide walks through installation, first queries, performance tuning, and exporting results.
How to Set Up Tableau Pulse for AI Metric Digests
Tableau Pulse is Tableau Cloud's AI-driven metrics layer that delivers personalized insights to users through email and Slack digests, without requiring them to open a dashboard. Setting it up involves enabling the feature in site settings, creating metric definitions from a published data source, configuring time dimensions and insight types, and connecting delivery channels. Once live, users follow specific metrics and receive automatic trend alerts and anomaly summaries.

How to Use NotebookLM Data Tables for Business
Google NotebookLM's Data Tables feature turns unstructured documents into structured, queryable tables using Gemini AI. You upload sources like PDFs, meeting notes, or reports, then prompt NotebookLM to extract specific fields into rows and columns. The output exports directly to Google Sheets for further analysis. Over 400 million Workspace users now have access to this feature, making it one of the fastest paths from raw documents to organized business data without writing code.

How to Use Excel Agent Mode for Automated Reports
Excel Agent Mode lets Microsoft 365 Copilot users automate multi-step reporting tasks directly inside a spreadsheet. You describe the outcome you want in plain English, and Copilot builds a plan, executes each step in your workbook, and validates the result. It works on Windows, Mac, and the web for any M365 Copilot, Personal, Family, or Premium subscriber. This guide walks through setup, effective prompts, and practical reporting workflows.

How to Set Up ThoughtSpot Spotter for AI Analytics
ThoughtSpot Spotter is ThoughtSpot's natural language analytics engine that lets business users query live data warehouse tables by typing plain English questions. You connect a cloud data source like Snowflake or BigQuery, build a semantic model, enable Spotter on that model, and start asking questions. The free trial includes sample data and supports up to five users for 30 days, with the Essentials plan starting at $25 per user per month after that.
How to Set Up Apache Superset with Docker
Apache Superset is a free, open-source business intelligence platform that supports over 40 visualization types and connects to virtually any SQL database. The fastest way to run it locally is with Docker Compose, which bundles Superset, a metadata database, a cache layer, and a sample PostgreSQL dataset in a single command. This guide walks through the full setup from Docker install to publishing your first interactive dashboard.

How to Set Up Snowflake Intelligence
Snowflake Intelligence is a conversational analytics agent that lets business users query structured and unstructured data in plain English without writing SQL. Setting it up requires an active Snowflake account, a semantic model defined in YAML that maps your business terms to database columns, and the ACCOUNTADMIN role to create the Intelligence object. Once configured, any team member can ask questions and get answers drawn directly from your warehouse.
How to Set Up Metabase for Self-Hosted Analytics
Metabase is a free, open-source business intelligence tool that lets teams query databases, build dashboards, and share reports without writing SQL. You can self-host it with a single Docker command or a Java JAR file. This guide walks through installation, connecting your first database, building your first dashboard, and the configuration steps most setup guides skip.

How to Use Looker Studio with Gemini AI
Looker Studio is a free Google dashboard builder. Its Gemini AI layer, unlocked through Looker Studio Pro, adds three practical features: Conversational Analytics for querying data in plain English, a Formula Assistant that writes calculated fields from a description, and a Slides export that turns dashboards into commented presentation decks. This guide covers the setup, how each feature works in practice, and the current limitations.

How to Use the =AI() Function in Google Sheets
Google Sheets now includes a built-in =AI() function powered by Gemini that lets users generate text, categorize data, extract information, and run sentiment analysis directly inside cells. The function accepts a natural language prompt and optional cell references, returning AI-generated output without leaving the spreadsheet. It is available in beta to Google Workspace Business, Enterprise, and AI Ultra subscribers as of March 2026.

How to Set Up Hex for AI Data Analysis
Hex is a collaborative data notebook that combines SQL, Python, and no-code tools with built-in AI agents for exploratory analysis. Setting it up requires connecting a data warehouse, endorsing trusted tables, adding descriptions, and configuring workspace context so the AI agent can generate accurate queries. The free Community plan supports unlimited public projects, and paid plans start at $36 per editor per month.
How to Set Up Sourcetable for AI Data Analysis
Sourcetable is an AI-native spreadsheet that connects to over 900 data sources and lets you query, clean, and visualize data using plain English. This guide walks through account setup, connecting your first data source, running AI-powered analysis, and building reusable workflows. A free tier and 7-day Pro trial are available with no credit card required.
How to Set Up Quadratic for Data Analysis
Quadratic is a free, open-source AI spreadsheet that lets you run Python, SQL, and JavaScript directly in cells alongside traditional formulas. With over 250,000 users and SOC 2 certification, it bridges the gap between spreadsheets and code-based analysis. This guide walks through account setup, data import, writing your first AI-assisted query, and building a chart, all in under 15 minutes.
How to Build a Business Dashboard with Notion Charts
Notion now supports native chart views and a dedicated dashboard layout, letting teams track business KPIs without leaving their workspace. You can create bar, line, donut, and number charts directly from any database, combine them into a filtered dashboard, and even ask the Notion Agent to build the whole thing from a text description. This guide walks through the full setup from database to live dashboard.

How to Set Up AI Automations in Airtable
Airtable now includes built-in AI automation actions that let you generate text, classify records, and extract structured data without writing code. This guide walks through setting up the "Generate with AI" action step by step, from choosing a trigger to configuring prompts that reference your table fields. Most teams can have a working AI automation running in under 15 minutes.

How to Use Julius AI for Business Data Analysis
Julius AI is a natural language data analysis platform that lets you upload CSV, Excel, or Google Sheets files and analyze them by asking questions in plain English. It generates charts, statistical summaries, and written insights without requiring SQL or Python. The free plan includes 15 messages per month; paid plans start at $20 per month for 250 messages. This guide covers setup, file upload, practical prompt strategies, and which plan fits different business use cases.

How to Set Up MindsDB Anton for Data Analysis
MindsDB Anton is an open-source autonomous BI agent that installs with a single terminal command and answers plain-language questions about your data. It connects to databases, CSVs, and APIs, then plans the analysis, writes and executes its own code, and returns tables, charts, and dashboards. Released April 2, 2026, Anton works on macOS and Linux and is free to use with an existing OpenAI or Anthropic API key.

How to Query CSV Files with SQL Using DuckDB
DuckDB is a free, in-process SQL database built for analytical workloads. It reads CSV, Parquet, and JSON files directly with no import step, no Python environment, and no server configuration. Install the CLI with a single command, open a terminal, and run SQL queries on any CSV file immediately. DuckDB version 1.5.1 is the current release. This guide covers installation on Mac, Linux, and Windows, plus the most common analysis queries business analysts and operators actually need.

How to Set Up PandasAI for Data Analysis
PandasAI is a Python library that lets you query, visualize, and clean data using plain English instead of code. Version 2 supports more than 100 LLM providers through LiteLLM, including OpenAI, Anthropic, and Google Gemini, and works with CSV files, Excel sheets, SQL databases, and cloud data warehouses. This guide walks through installation, LLM configuration, and running your first real queries on a dataset in under 15 minutes.

How to Set Up Looker Studio for Business Reporting
Looker Studio is a free dashboarding tool from Google that connects to more than 1,050 data sources including Google Sheets, BigQuery, and Salesforce. To set it up for business reporting, sign in with a Google account, connect a data source, build a report with charts and filters, and share via link. No SQL or coding knowledge is required, and most teams are running their first dashboard within two hours.

How to Set Up a Microsoft Fabric Data Agent
Microsoft Fabric Data Agents let business users ask plain English questions against enterprise data -- including Power BI semantic models, lakehouses, and warehouses -- and receive answers without writing SQL or DAX. The feature requires F2 or higher Fabric capacity, six tenant settings enabled by an admin, and at least one structured data source already in OneLake. Setup takes under an hour end to end. As of early 2026, the core feature is available in Fabric workspaces, with Copilot Studio integration in preview.
How to Use Python in Excel
Python in Excel is a Microsoft 365 feature that runs Python code directly in spreadsheet cells using a cloud-based Anaconda environment. No local Python installation is required. It gives Excel users access to pandas, matplotlib, NumPy, and scikit-learn through the =PY() formula. The feature is available on Excel for Windows, Mac, and the web for active Microsoft 365 subscribers. All execution happens in Microsoft's cloud, so results are returned to the worksheet without any setup beyond opening Excel.

How to Use Gemini AI in Google Sheets
Google's native =AI() function in Sheets, powered by Gemini, lets you run text analysis, classification, and summarization directly in spreadsheet cells using plain English prompts. It ships with paid Google Workspace plans at Business Standard tier and above, plus Google One AI Premium. The function handles up to 200 cells per batch, outputs plain text, and requires one-time admin enablement on workspace accounts. It does not auto-update and cannot nest inside other formulas without a workaround.

How to Analyze Business Data with Claude AI
Claude can analyze business data from a CSV or Excel file without any coding. Upload a file to Claude.ai, describe what you want to know, and Claude reads the actual rows and calculates results using its built-in analysis tool. This guide covers the exact workflow, prompt templates that produce reliable output, and the single instruction that prevents Claude from returning estimated numbers instead of real ones.

How to Set Up Metabase for Business Analytics
Metabase is a free, open-source business intelligence tool that lets non-technical teams query databases and build dashboards without writing SQL. It installs in under 30 minutes via Docker, a JAR file, or Metabase Cloud. Once connected to a database, teams can build charts, share dashboards, and filter data with a point-and-click interface. Version 0.59 supports over 20 databases including PostgreSQL, MySQL, BigQuery, Snowflake, and Redshift.

How to Use Julius AI for Data Analysis
Julius AI is a no-code data analysis tool that lets you upload a CSV, Excel, or Google Sheets file and ask questions in plain English to get charts, statistics, and written insights instantly. It supports exploratory data analysis, correlation tests, regression, and ANOVA without writing a single line of code. Most analyses complete in under 30 seconds, making it practical for operations managers, analysts, and founders who need answers from data without waiting on a data team.
How to Set Up Airtable AI for Data Analysis
Airtable AI adds generative AI directly into your database as fields, automations, and a chat assistant. You add an AI field to any base, reference your existing columns in a prompt, and Airtable generates text output for every record automatically. Common tasks include summarizing feedback, scoring leads, categorizing support tickets, and drafting outreach messages. No external tools or coding required.
How to Set Up Apache Superset Dashboards
Apache Superset is a free, open-source business intelligence platform that lets teams build interactive dashboards connected to any SQL database. Setting it up requires Docker and a few terminal commands, but no coding knowledge is needed once it is running. This guide covers installation, database connection, chart creation, and dashboard assembly for teams that want full control over their data without a monthly BI subscription.

How to Set Up Coefficient AI in Google Sheets
Coefficient is a Google Sheets add-on that connects spreadsheets to live data from Salesforce, HubSpot, Snowflake, and more than 100 other business systems. It refreshes data automatically on a schedule, triggers Slack and email alerts when key metrics change, and includes an AI Sheets Assistant that builds formulas, charts, and pivot tables from plain-English commands. The free plan supports three connectors. Paid plans start at $59 per user per month.
How to Set Up Grafana for Business Dashboards
Grafana is an open-source analytics platform that lets teams build live dashboards from databases, spreadsheets, and APIs without writing custom code. Originally built for infrastructure monitoring, it works just as well for business metrics: sales trends, ops KPIs, and team performance reports. This guide walks through installing Grafana, connecting a data source, and publishing your first business dashboard in under an hour.

How to Use Gemini AI in Looker Studio
Gemini AI in Looker Studio adds three features to the familiar dashboard builder: a Formula Assistant that writes calculated fields from plain English, Conversational Analytics that generates charts from natural language questions, and a Google Slides export that turns dashboards into narrated presentations. All three require a Looker Studio Pro subscription at $9 per user per project per month. Setup takes under ten minutes if you already use Google Workspace.
How to Set Up Metabase for Business Dashboards
Metabase is a free, open-source business intelligence tool that connects to your database or accepts CSV uploads and turns that data into charts, dashboards, and automated reports without requiring SQL or engineering support. Using Metabase Cloud, the hosted version, you can go from sign-up to a published dashboard in under 30 minutes. This guide covers account setup, connecting your first data source, building a chart, and scheduling a dashboard email report.

How to Analyze CSV and Excel Files with DuckDB
DuckDB is a free, open-source analytical database that runs as a single binary on your laptop. It lets you query CSV and Excel files using standard SQL without installing a server, writing Python, or uploading data to a cloud tool. Setup takes under two minutes on Mac, Windows, or Linux. This guide covers installation, querying CSV files, reading Excel spreadsheets, joining multiple data files, and exporting results.

How to Set Up Marimo for Data Analysis
Marimo is an open-source Python notebook that replaces Jupyter's execution model with a reactive dependency graph. When a cell's variables change, dependent cells rerun automatically, eliminating stale output bugs. It supports SQL via DuckDB, interactive widgets, and deploys as a web app with one command. Teams at BlackRock and Shopify have adopted it for reproducible analytical workflows.
How to Set Up Tableau Pulse for AI Analytics
Tableau Pulse is the AI analytics layer inside Tableau Cloud that monitors your key metrics and delivers plain-language insights to email and Slack on a schedule. Enabling it requires three steps: turning it on in site settings, publishing a clean data source to Tableau Cloud, and defining at least one metric. Skipping the data preparation step is the most common reason organizations enable Pulse and see no useful output.
How to Set Up Julius AI for Data Analysis
Julius AI is a browser-based tool that lets you upload spreadsheets, CSVs, or connect a live database and analyze data through plain-English questions. It runs Python under the hood and returns charts, tables, and written summaries. The free plan is limited to 15 messages per month. Paid plans start at $35 per month and unlock faster models, larger file handling, and live database connectors.

How to Switch from Pandas to Polars for Faster Analysis
Polars is a DataFrame library built in Rust that processes CSV and tabular data significantly faster than Pandas, with benchmarks showing 2.5x to 11x speed improvements depending on the operation. This guide covers installing Polars, translating the most common Pandas operations into Polars syntax, and deciding when the switch makes sense based on dataset size and workflow needs.

How to Set Up Gumloop for AI Workflow Automation
Gumloop is a no-code platform for building AI-powered automation workflows using a visual drag-and-drop canvas. To get started, create a free account, select or build a workflow using the node editor, connect your integrations, configure an AI node with your preferred language model, and run the workflow. The free plan includes 5,000 credits per month and supports unlimited flows and agents with no coding required.

How to Set Up Polymer AI for Spreadsheet Dashboards
Polymer AI is a no-code business intelligence tool that converts spreadsheets and CSVs into interactive dashboards without writing code or SQL. You upload a file or connect Google Sheets, and Polymer automatically detects column types, suggests visualizations, and builds a filterable dashboard in under a minute. This guide walks through account setup, data import, dashboard creation, sharing options, and practical tips for getting clean results from messy spreadsheet data.

How to Set Up the DuckDB Local UI for CSV Analysis
DuckDB's local UI is a browser-based SQL notebook that runs entirely on your machine, letting you query CSV, Parquet, and JSON files with standard SQL and zero server setup. Install DuckDB v1.2.1 or later, run "duckdb -ui" in your terminal, and the interface opens automatically with syntax highlighting, autocomplete, and real-time result previews. Your data never leaves your computer unless you explicitly connect to a cloud service.

How to Use Google NotebookLM for Data Analysis
Google NotebookLM lets you upload CSVs, spreadsheets, and PDFs, then query them in plain English to generate structured data tables, spot trends, and cross-reference multiple sources. This tutorial walks through the full data analysis workflow, from uploading your first dataset to exporting findings, using features most guides overlook: custom instructions for analytical rigor, deep research for supplementary context, and multi-notebook queries via Gemini integration.
How to Set Up Rows AI for Spreadsheet Analysis
Rows is a cloud spreadsheet platform with a built-in AI Analyst that lets you clean, analyze, and visualize data using plain English prompts instead of formulas. You connect live data sources, ask questions like "average revenue by region," and get computed answers, new columns, and charts directly in the spreadsheet. Setup takes under five minutes with a free account, and the AI Analyst handles everything from sentiment analysis to predictive modeling without requiring any code.
How to Set Up Supermetrics AI for Marketing Reports
Supermetrics AI connects your marketing platforms to AI assistants like Claude, ChatGPT, and Gemini so you can query campaign data in plain English. Setup takes under ten minutes: connect your ad accounts through the Supermetrics Hub, enable the AI destination, and link your preferred assistant. The platform also offers a Model Context Protocol server for developers who want direct programmatic access to marketing data through AI agents.
How to Use Perplexity Deep Research for Data Analysis
Perplexity Deep Research can function as a data analysis assistant that gathers, cross-references, and synthesizes quantitative information from across the web. By structuring your prompts with specific metrics and constraints, you can extract market data, benchmark statistics, and trend figures into organized reports with full source citations. This tutorial walks through the complete workflow from query design to validated, export-ready data tables.

How to Set Up Lindy AI for Data Workflows
Lindy AI is a no-code agent platform that lets you build automated data workflows using natural language. You describe what you need, connect your data sources through 5,000+ integrations, and Lindy's AI agents handle collection, processing, and reporting without any code. The free tier includes 400 credits per month, enough to test most data automation use cases before committing to a paid plan.

How to Set Up Deepnote for AI Data Analysis
Deepnote is a cloud-based data notebook that combines Python, SQL, and AI in one collaborative workspace. To set it up for AI data analysis, create a free account, start a new project, connect your data source, and use Deepnote Agent or Auto AI mode to generate code, run queries, and build visualizations from plain English prompts. The free plan includes basic AI features, while the Team plan unlocks unlimited AI assistance.
How to Set Up Airtable AI Field Agents
Airtable AI field agents are cell-level AI workers that automatically analyze, categorize, and generate data inside your existing tables. To set them up, add an AI field type to any table, choose a task (generate text, categorize, tag, or suggest links), write plain-English instructions referencing other fields, and select a model. Field agents run per record and cost credits, so disabling automatic triggers and choosing lighter models for simple tasks keeps costs predictable while still replacing hours of manual data cleanup and classification.

How to Set Up Quadratic for AI Data Analysis
Quadratic is a free, browser-based spreadsheet that lets you write Python, SQL, and JavaScript directly in cells alongside traditional formulas. Its built-in AI assistant generates and debugs code from plain English prompts, making it practical for analysts and operators who need more than formulas but do not want to manage notebooks or local environments. This guide walks through setup, data import, and running your first AI-assisted analysis.

How to Set Up GA4 Analytics Advisor
GA4 Analytics Advisor is Google's built-in AI chat feature that lets you ask questions about your website data in plain English instead of navigating complex reports. To use it, you need a properly configured GA4 property with active event tracking and sufficient data history. This guide walks through the full setup, shows effective query examples, and explains common pitfalls that lead to misleading answers.

How to Use Julius AI for Data Analysis
Julius AI lets you upload a CSV or Excel file and ask questions about your data in plain English. It returns charts, statistical summaries, and written insights without requiring any code. This guide walks through account setup, data upload, effective prompting strategies, and how to export results, so you can go from raw spreadsheet to finished analysis in minutes.

How to Set Up Grist for AI Data Cleaning
Grist is a free, open-source spreadsheet platform with a built-in AI assistant that generates Python formulas from plain English prompts. To set it up for data cleaning, create a free account at getgrist.com, import your messy dataset, open the AI assistant from the Tools menu, and describe what you need fixed. The assistant handles duplicate detection, date standardization, format corrections, and category normalization without requiring any code.
How to Set Up Sourcetable for AI Data Analysis
Sourcetable is an AI-native spreadsheet platform that connects to over 900 data sources and lets users run analysis, build models, and generate reports using plain English. To set it up, create a free account, connect a database or upload a file, and use the AI assistant to query your data. The platform supports files up to 10GB and handles datasets exceeding one million rows without browser slowdown.

How to Set Up Flourish for Data Visualization
Flourish is a free, browser-based platform that turns spreadsheet data into interactive charts, maps, and stories without writing code. You pick a template from over 50 options, paste or upload your data, map columns to visual variables, customize colors and labels, then publish with an embed code or shareable link. The entire process takes under ten minutes for a basic chart, and your data never leaves your browser during editing.

How to Set Up Notion Dashboard Views
Notion dashboard views let you combine multiple database views, charts, boards, and calendars into a single control panel inside any Notion database. Released in March 2026 for Business and Enterprise plans, they replace the old method of stacking inline views on a page. You set them up by adding a new dashboard view to any database, then arranging up to 12 widgets with drag-and-drop layout controls and global filters that apply across all widgets at once.

How to Set Up Ask Zia in Zoho Analytics
Ask Zia is the built-in AI assistant in Zoho Analytics that lets you create reports, dashboards, and data pipelines using plain English prompts. It is included at no extra cost on Premium and Enterprise plans, supports synonym training so it understands your business terminology, and can forecast trends or flag anomalies automatically. This guide walks through the full setup from data import to your first AI-generated dashboard.

How to Set Up Powerdrill Bloom for Data Analysis
Powerdrill Bloom is an AI-first data exploration platform that lets you upload a spreadsheet, receive automated analysis through AI agents, and export findings as presentation-ready slides. This guide walks through account creation, your first data upload, navigating the AI canvas, asking follow-up questions, and exporting results to PowerPoint. No SQL or coding knowledge is required to get started.

How to Set Up JetBrains Databao for Data Analysis
Databao is an open-source data agent from JetBrains that lets you query databases in plain English and get answers as text, charts, and tables. You install it with pip, connect a database through SQLAlchemy, configure an LLM provider, and start asking questions in Python or through the CLI. It supports PostgreSQL, MySQL, Snowflake, BigQuery, DuckDB, SQLite, and Pandas DataFrames, and ranked first on the Spider 2.0 DBT benchmark for text-to-SQL accuracy.

How to Set Up the Hex Notebook Agent
The Hex Notebook Agent is an AI assistant built into the Hex analytics platform that generates SQL, Python, charts, and pivot tables from plain-English prompts. To set it up, create a free Hex account, connect a data warehouse, enable AI features in workspace settings, and open a new project where the agent appears as a sidebar ready to build and edit notebook cells on your behalf.
How to Use NotebookLM Data Tables
Google NotebookLM Data Tables lets you turn unstructured documents into clean, column-based tables using plain English prompts. You upload sources such as PDFs, meeting transcripts, or web pages into a notebook, describe the table structure you need, and NotebookLM extracts the relevant data into rows and columns. The resulting tables can be exported directly to Google Sheets for further analysis, sharing, or visualization.

How to Set Up ChatGPT for Excel
OpenAI's ChatGPT for Excel is a beta add-in that brings GPT-5.4 directly into Excel workbooks. It lets users build financial models, run scenario analysis, clean data, and trace formula errors using plain English prompts. The add-in is available to ChatGPT Plus, Pro, Business, Enterprise, and Edu subscribers in the US, Canada, and Australia. This guide covers installation, core workflows, and the new financial data integrations with FactSet, S&P Global, and Moody's.
How to Set Up and Use Metabase Metabot
Metabase Metabot is an AI assistant that lets teams ask questions in plain English and receive SQL-backed charts, query results, and data summaries directly inside Metabase. It integrates with your existing data models and permission settings so users only see data they are authorized to access. Metabot is available as a paid add-on for Metabase Cloud instances and requires admin configuration before use.

How to Set Up Pecan AI Predictive Agent
Pecan AI launched its Predictive Agent in January 2026, letting operations managers and business analysts build ML-based forecasts for churn, demand, and lifetime value without writing code or involving a data scientist. The platform works through a five-step conversational and SQL notebook workflow. Users connect a data warehouse or upload a CSV, answer four plain-English questions about their prediction goal, and receive a trained model within 15 to 60 minutes.

How to Set Up Omni Analytics for Reporting
Omni Analytics is a business intelligence platform that connects to your existing data warehouse and lets team members query data in plain English without writing SQL. To get started, you connect a supported database such as Snowflake, BigQuery, or PostgreSQL, build a semantic model called a Topic, add business context to tune the AI assistant, and publish dashboards for self-service reporting. Most teams complete setup in under two hours.

How to Set Up Sigma Agents for Data Workflows
Sigma Agents are AI-powered workflow automations built into Sigma Computing that monitor live warehouse data and trigger actions in connected tools like Slack, Jira, and CRMs. Three modes are available: conversational (query-driven), human-in-the-loop (approval-based), and autonomous (scheduled background monitoring). Agents require an existing cloud data warehouse on Snowflake, Databricks, or a major cloud provider. Conversational agents went live in April 2026, with autonomous agents rolling out later in the year.

How to Set Up ThoughtSpot Spotter
ThoughtSpot Spotter is an AI analyst embedded in the ThoughtSpot platform that answers business questions in natural language, returning charts and data summaries without requiring SQL or BI expertise. To get started, sign up for a free trial, upload a CSV or connect a cloud data warehouse, select the relevant tables, and type questions directly into the Spotter chat interface. Results appear as interactive charts that can be pinned to a Liveboard for ongoing monitoring.

How to Use Copilot in Excel for Data Analysis
Microsoft Copilot in Excel is an AI assistant that answers questions about your spreadsheet data in plain English and returns charts, summaries, and PivotTables without formulas. It requires a Microsoft 365 Copilot license, data formatted as an Excel Table, and a file saved to OneDrive. Prompts go into a side panel and results appear directly in the sheet.
How to Set Up Metabase as a Free Power BI Alternative
Metabase is an open-source business intelligence tool that connects directly to databases like PostgreSQL, MySQL, and BigQuery and lets non-technical users build charts and dashboards without writing SQL. The open-source version is free and runs on a single Docker command or a downloadable JAR file. Teams switching from Power BI report significant time savings by eliminating DAX formulas and per-seat license fees.
How to Set Up Databricks Genie
Databricks Genie is a natural language analytics interface built into the Databricks platform that lets business users query data by asking questions in plain English instead of writing SQL. Setting it up requires registering tables in Unity Catalog, configuring a Genie space with curated metadata and sample queries, and connecting a SQL warehouse. This guide walks through each step, including how to build the knowledge store that determines whether Genie gives accurate or misleading results.

How to Use BigQuery Data Canvas
BigQuery Data Canvas is a visual, node-based workspace inside Google Cloud Console that lets analysts query and chart BigQuery data without writing SQL from scratch. Users chain search, query, and visualization nodes on a drag-and-drop canvas, with Gemini AI generating SQL from natural language prompts. Two IAM roles and an enabled Gemini API are all that is required to get started. This guide covers setup, building an analysis, and the practical limits of the canvas environment.

How to Use Gemini in Looker Studio
Gemini AI is integrated into Looker Studio Pro and delivers three features: conversational analytics for querying data in plain English, a formula assistant for calculated fields, and Slides integration for converting dashboards into presentations with AI-generated summaries. All three features require a Looker Studio Pro subscription and correct IAM permissions configured in your Google Cloud organization. Once enabled, you can ask questions directly in your dashboard and receive charts or tables without writing SQL or formulas.

How to Set Up Oracle Analytics Cloud AI Agents
Oracle Analytics Cloud AI Agents, introduced in the March 2026 platform update, let teams configure a purpose-built AI assistant tied to a specific dataset and paired with uploaded policy or reference documents. The agent uses retrieval-augmented generation (RAG) to ground answers in both quantitative data and internal documentation. Setup requires the January 2026 instance update or later, appropriate permissions, and clean upstream data with key fields at least 95 percent complete.
How to Analyze CSV Files with DuckDB
DuckDB lets you run SQL queries directly on CSV files without importing data into a database, installing a server, or paying for cloud infrastructure. Install it with a single command, point it at any CSV file, and execute standard SQL. DuckDB runs entirely in-process on your local machine, infers column types automatically, and handles files up to several gigabytes without any configuration.

How to Use Copilot in Power BI (2026 Guide)
Copilot in Power BI lets business users ask questions about reports and data in plain English, generate new visuals on demand, and summarize entire reports without writing DAX or SQL. It requires a paid Fabric capacity (F2 or higher) or Power BI Premium (P1 or higher) and is enabled by default in qualifying environments. The standalone Copilot experience, introduced in early 2026, extends this to any data in your workspace, not just an open report.

How to Use Snowflake Cortex Analyst
Snowflake Cortex Analyst is a managed AI feature inside Snowflake that lets business users query structured data using plain English rather than SQL. Once a data team sets up a semantic model describing tables and metrics, any user can type a question such as "What were our top five customers by revenue last quarter?" and receive a direct answer. The feature converts natural language to SQL internally and returns results within seconds.

How to Use ThoughtSpot Spotter
ThoughtSpot Spotter is the conversational AI layer in ThoughtSpot that lets business users query a cloud data warehouse in plain English and receive charts, tables, and follow-up answers without writing SQL. It translates natural language into ThoughtSpot search tokens routed through a governed semantic layer, producing consistent results across teams. Setup requires a warehouse connection, a modeled worksheet, and access sharing, typically completed in one business day by a data engineer.
How to Create a Databricks AI/BI Dashboard
Databricks AI/BI Dashboards let analysts and data teams build interactive reports directly inside the Databricks workspace using SQL queries and built-in visualizations. As of March 2026, Databricks added AI-assisted authoring through Genie Code, which lets users create datasets, charts, filters, and layouts from a single natural language prompt. You need a Databricks SQL entitlement and access to at least one SQL warehouse to get started.

How to Build Your First Sigma Computing Workbook
Sigma Computing is a cloud-based analytics tool that lets analysts and ops teams build interactive dashboards directly on Snowflake, BigQuery, or Databricks data without writing SQL. To build your first workbook, connect your data warehouse as a data source, open a table as an exploration, group and aggregate the data you need, add a chart, and publish. The full process takes under thirty minutes from a live data connection.

How to Build a Business Dashboard in Looker Studio
Google Looker Studio is a free, browser-based reporting tool that connects to Google Sheets, BigQuery, and over 1,050 other data sources to produce interactive, shareable dashboards without writing code. You can build a working business dashboard in under 30 minutes by connecting your data, adding charts, and setting a date filter. Dashboards connected to Google Sheets refresh automatically every hour by default, with a minimum interval of 15 minutes.
How to Use Quadratic for AI Spreadsheet Analysis
Quadratic is a web-based AI spreadsheet that runs Python, SQL, and JavaScript directly inside cells, letting analysts and business users perform complex analyses without a separate coding environment. Users sign up free at app.quadratichq.com, upload or connect their data, and type plain-English prompts to generate formulas, charts, or statistical models. The AI produces working, inspectable code that runs in the browser with no local setup required.
How to Build a Local Analytics Pipeline with dbt and DuckDB
dbt Core and DuckDB together let you build a complete SQL transformation pipeline that runs entirely on your laptop, with no server, no cloud account, and no infrastructure costs. You install two Python packages, point a profiles.yml file at a local database file, write SQL models, and run dbt run. This guide walks through the full setup from scratch, including a working model that transforms CSV data into a clean analytics table.

How to Build Your First Power BI Dashboard
Power BI Desktop is a free Windows application from Microsoft that connects to Excel files, CSV exports, SQL databases, and more than 100 other data sources, then lets you build interactive charts and dashboards without writing code. Getting a first report built takes about 30 to 60 minutes with data you already have. Sharing those reports with colleagues requires a Power BI Pro license at roughly $10 per user per month. The free tier lets you build and publish only to a private personal workspace.

How to Use Manus AI for Data Analysis
Manus AI is an autonomous agent that accepts CSV and Excel uploads, runs analysis using internal Python execution, and delivers finished outputs including slide decks, interactive dashboards, and PDF reports without the user writing code or SQL. Sign up at manus.im with a Google or email account, upload a file, describe the output you want in plain English, and Manus delivers a complete, exportable result.

How to Set Up Amazon QuickSight Q for Analytics
Amazon QuickSight Q is a natural language interface built into AWS's business intelligence platform that lets you query your data by typing plain English questions rather than writing SQL. To use it, you need a QuickSight Enterprise subscription, at least one SPICE dataset, and a configured Q Topic. Once set up, you can ask questions like "What were sales by region last month?" and receive instant chart or table answers. Setup takes under 30 minutes for most business users.
How to Set Up Metabase for Business Analytics
Metabase is a free, open-source business intelligence tool that lets teams build charts, dashboards, and reports from a connected database without writing code or SQL. You can set it up in under 30 minutes using Metabase Cloud, or self-host it with Docker on any VPS. After connecting a database and configuring an admin account, anyone on your team can query data and build shareable dashboards through a point-and-click visual interface.

How to Build an Internal Dashboard with Retool
Retool is a low-code platform for building internal dashboards by connecting databases, APIs, and spreadsheets to drag-and-drop UI components. You create a data source connection, write a SQL or structured query, and bind the results to tables, charts, or KPI cards. Teams at operations-heavy companies use it to ship functional data apps without custom code. This guide walks through the full setup from data connection to publishing.

How to Get Started with Sigma Computing
Sigma Computing is a cloud analytics platform with a spreadsheet-like interface that connects directly to data warehouses such as Snowflake and BigQuery. It requires no SQL for basic analysis and lets teams query live data at scale. To get started, you need a supported cloud data warehouse, a free 14-day trial account, and about 30 minutes to connect your first dataset and build a workbook with charts and filters.

How to Get Started with Hex for Data Analysis
Hex is a browser-based analytics workspace that lets analysts run SQL, Python, and no-code analysis in one place, with an AI Notebook Agent that generates queries and charts from plain-English prompts. You can connect a data warehouse or upload a CSV, describe the analysis you need, and get an interactive report without writing any code. This guide walks through account setup, data connection, and running your first AI-assisted analysis from scratch.

How to Use Tableau Public for Business Reporting
Tableau Public is a free data visualization tool from Tableau that lets you connect spreadsheets and CSV files, build interactive charts, and publish dashboards to the web. Business users without a coding background can create sales summaries, operational dashboards, and trend reports in under an hour. The main trade-off is that all published dashboards are publicly accessible, which makes it better suited for non-sensitive external reports than for internal company data.
How to Set Up Apache Superset for Analytics
Apache Superset is a free, open-source business intelligence platform that lets teams connect databases, build charts, and publish shared dashboards without a Tableau or Power BI subscription. It supports over 40 chart types and connects to more than 40 databases including PostgreSQL, MySQL, BigQuery, and Snowflake. Setup using Docker Compose takes under 15 minutes. Airbnb built it internally in 2015 and donated it to the Apache Software Foundation in 2017.

How to Set Up Metabase for Business Analytics
Metabase is an open-source business intelligence tool that lets any team member query databases and build dashboards without writing SQL. You can deploy it in under 15 minutes using Docker or sign up for Metabase Cloud. Once connected to a database, you create saved queries called questions, combine them into interactive dashboards, and share reports via link, email subscription, or Slack.

How to Get Started with ThoughtSpot AI Analytics
ThoughtSpot is an AI-powered analytics platform that lets business users query live cloud data warehouses using plain English questions, without writing SQL or pre-building dashboards. It connects to Snowflake, BigQuery, Redshift, and other major warehouses, and includes Spotter, an AI reasoning engine that explains why data patterns occur. Organizations can set up a working dashboard in under two hours using the 30-day free trial.
How to Analyze Multiple CSV Files with DuckDB
DuckDB is a free, in-process analytical database that runs SQL queries directly against CSV files from the command line. No server, no Python environment, and no database schema are required. You can combine multiple monthly export files with a single glob pattern, join related CSV tables, handle malformed rows, and export clean results to a new file. For analysts who work with downloaded exports from business tools, DuckDB replaces manual spreadsheet work and fragile scripts with repeatable SQL queries.

How to Query Business Data with Plain English
Text-to-SQL tools let you ask questions about your business data in plain English and get accurate database queries back without writing a single line of SQL. In 2026, leading tools including Vanna.ai, SQLAI.ai, and SQL Chat achieve 85 to 95 percent accuracy on standard queries and connect directly to databases like PostgreSQL, MySQL, Snowflake, and BigQuery. Analysts report cutting query time by 60 percent after adopting these tools.

How to Set Up Looker Studio for Business Reporting
Looker Studio is a free Google tool that converts spreadsheets and databases into shareable, interactive dashboards without writing code. Connect a Google Sheet, drag on chart types, and share a live link that updates automatically. Setup takes under 30 minutes for a first working report. The platform queries your data live on every load, so stakeholders always see current numbers without a manual refresh step.
How to Clean Messy Data with OpenRefine
OpenRefine is a free, open-source desktop application that lets analysts clean and standardize messy datasets without writing code. You download and install it on your computer, import a spreadsheet or CSV, then use its faceting, clustering, and transformation tools to fix inconsistencies, remove duplicates, and standardize values. Data never leaves your machine. Setup takes about five minutes, and most cleaning tasks are completed through menus and point-and-click operations.

How to Get Started with Deepnote for Data Analysis
Deepnote is a cloud-based collaborative data notebook that combines SQL, Python, and no-code blocks in a single workspace. It supports real-time co-editing, connects directly to databases and warehouses like Snowflake and BigQuery, and recently went open source under the Apache 2.0 license. This guide walks through account setup, project creation, data connections, and sharing results with a team.
How to Set Up Quadratic for Spreadsheet Analysis
Quadratic is a free, browser-based AI spreadsheet that lets you write Python, SQL, and JavaScript alongside traditional formulas. To get started, create an account at app.quadratichq.com, import a CSV or Excel file, and use the built-in AI assistant or code cells to clean, transform, and visualize your data. No installation or configuration is required.
How to Get Started with Zerve for Data Analysis
Zerve is an agentic data workspace that combines AI-powered notebooks, data discovery, and one-click deployment in a single browser-based environment. To get started, create a free account, open a canvas, connect your data source or upload a file, and prompt the built-in AI agent to run your analysis. Zerve supports Python, R, and SQL in the same project and handles parallelization and scheduling without additional infrastructure.

How to Analyze CSV Data with Claude AI
Claude AI can analyze CSV files directly in the browser. Upload a file through the paperclip icon, ask questions in plain English, and Claude writes and runs JavaScript code behind the scenes to clean, filter, summarize, and chart your data. It handles files up to 30 MB and works best with datasets under 50,000 rows, making it practical for most business reporting tasks without any coding or tool setup required.
How to Use Rows AI for Spreadsheet Analysis
Rows AI is a browser-based spreadsheet platform with a built-in AI analyst that lets you clean, analyze, and visualize data using plain English prompts. You can upload a CSV or connect live data from tools like Google Ads or HubSpot, then ask questions directly in the spreadsheet to get summary tables, charts, and statistical breakdowns without writing formulas or code.

How to Use Perplexity Deep Research for Market Analysis
Perplexity Deep Research is a Pro feature that runs multi-step web research autonomously and delivers a structured, cited report in under five minutes. To use it for market analysis, open Perplexity, select Deep Research mode, enter a focused market question, and let the system synthesize findings from dozens of sources. The output includes a narrative summary with inline citations that you can export, share with stakeholders, or feed into further analysis tools.
How to Set Up Metabase for Self-Service Analytics
Metabase is a free, open source business intelligence tool that lets non-technical teams query databases, build dashboards, and share reports without writing SQL. You can deploy it with a single Docker command, connect it to PostgreSQL or any of 20-plus supported databases, and have your first interactive dashboard running in under an hour. This guide walks through every step from installation to team sharing.

How to Use the AI Function in Google Sheets
Google Sheets now includes a built-in =AI() function powered by Gemini that lets you run AI prompts directly inside spreadsheet cells. You can use it to categorize text, analyze sentiment, extract data from unstructured content, and generate summaries without leaving your spreadsheet. The function accepts a text prompt and an optional cell range as inputs and works on Google Workspace Business, Enterprise, and Education Plus plans as well as the Google AI Pro add-on.

How to Get Started with Microsoft Fabric
Microsoft Fabric is a SaaS analytics platform that combines data storage, transformation, and reporting in a single environment. Business users who already work with Excel or Power BI can start with a free 60-day trial, create a workspace in minutes, and connect data sources without managing infrastructure. This guide walks through the core components and practical first steps to run your first report inside Fabric.
How to Query CSVs Instantly with DuckDB
DuckDB is a free, serverless analytical database that lets analysts run fast SQL queries directly against CSV files without installing a database or writing Python. Released as a single downloadable binary, it runs on a laptop and handles files with tens of millions of rows without loading them into memory. As of early 2026, DuckDB had recorded over 50 percent year-over-year developer growth, driven largely by its zero-configuration setup and speed on local data files.

How to Build a Dashboard in Tableau Public
Tableau Public is a free application that lets you connect a CSV or spreadsheet, build interactive charts, and publish a shareable dashboard to the web without writing any code. The workflow has four main steps: prepare a flat data file, connect it in Tableau Public Desktop, build one worksheet per chart, and assemble the charts on a dashboard canvas before publishing. A basic four-chart dashboard takes under an hour to complete from scratch.

How to Automate Weekly Reports with n8n
n8n is an open-source workflow automation platform that can read data from Google Sheets, generate an AI-written summary, and email it to your team on a recurring schedule, all without writing code. By connecting four to six nodes in sequence, any analyst or operations manager can build a weekly reporting pipeline in under an hour using n8n's free cloud tier or a self-hosted install.

How to Set Up Power BI Desktop for Reporting
Power BI Desktop is a free Windows application from Microsoft that connects to spreadsheets, databases, and cloud services to produce interactive dashboards. Setting it up takes about 30 minutes: download the app, import a data source, clean the data in Power Query, and build a visual. This guide covers each step for analysts and operators who want structured reports without writing code or hiring a data engineer.

How to Use Copilot in Excel for Business Analysis
Microsoft Copilot in Excel lets business users analyze, summarize, and visualize spreadsheet data through plain English prompts without writing formulas or macros manually. It requires a Microsoft 365 subscription with a Copilot add-on and works on data formatted as a table. The 2026 version adds PDF data extraction, chained multi-step prompts, and automatic dashboard generation, making it more capable for operations and finance teams that rely on Excel for regular reporting.
How to Set Up Metabase for Business Intelligence
Metabase is an open-source business intelligence tool that lets non-technical teams connect databases, build charts, and share dashboards without writing SQL. Setting it up takes under 30 minutes using either the free JAR file method, a Docker container, or managed Metabase Cloud. Once connected to a data source, any team member can ask questions in plain English and get visualizations without code.

How to Build a Looker Studio Dashboard from a CSV
Google Looker Studio is a free tool that turns spreadsheet and CSV data into interactive business dashboards without writing code. You connect a Google Sheet or upload a CSV, map your columns to chart types, and publish a live report your whole team can view. The main obstacles are messy source data and data type mismatches, both of which are preventable with a few formatting steps before you connect.

How to Analyze Data in Google Sheets with Gemini
Google Sheets now includes Gemini as a built-in AI assistant that can generate formulas, summarize datasets, and identify trends from natural language prompts. To use it, you need a Workspace Business Standard plan or Google One AI Premium subscription. This guide walks through enabling Gemini, writing effective prompts for data analysis, using the =AI() function in cells, and working around the key limitations like the 350-cell generation cap and missing undo support.

Statistical Analysis for Excel Users Without Code
Business analysts who rely on Excel hit a ceiling fast: pivot tables can summarize data but cannot run regression, cohort analysis, or trend decomposition without writing formulas or learning Python. In 2026, AI-native tools let analysts upload a spreadsheet and ask questions in plain English for full statistical output. Platforms like vslzai.com go further by combining data cleaning, analysis, and chart generation in one agentic workflow, removing the need to switch tools mid-analysis.
When to Replace Excel with Automated Reporting
For operations managers and founders who update the same spreadsheets every week, manual reporting costs more time than it saves. Tools like Looker Studio, Zoho Analytics, and Coefficient automate data refresh and delivery across common business data sources. VSLZ AI goes further by accepting a plain-English prompt and returning statistical analysis, charts, and written narrative from a connected data source without formula-writing or dashboard configuration. The key differentiator is end-to-end output from a single prompt.

AI Data Visualization Tools for Non-Coders
Business analysts, ops managers, and founders who rely on spreadsheets have long struggled to turn raw data into charts without hiring a developer. The best no-code AI data visualization tools in 2026 let users upload a file, ask a plain-English question, and get instant output. Legacy platforms like Tableau and Power BI require setup expertise. vslzai.com's Data Agent V2.0 handles the full workflow from a single prompt, covering statistical analysis and chart generation together.
OpenClaw for Data Analysis: What Non-Coders Should Know
OpenClaw, the open-source AI agent with 247,000 GitHub stars, has captured attention for its ability to query databases and analyze CSVs via chat. But for data analysts, ops managers, and founders who need structured statistical analysis, clean charts, and shareable reports from messy spreadsheets, a dedicated data storytelling platform delivers more reliable results. VSLZ AI takes a single prompt from data upload to end-to-end output, no code or configuration required.

AI Agents for Data Analysis Without Code
Data analysts, operations managers, and founders who rely on Excel face a recurring problem: raw files rarely become clear insights without hours of manual work or a specialist. The rise of autonomous AI agents like OpenClaw has raised expectations for single-step automation. VSLZ AI brings that logic to data storytelling. Users upload a file or connect a source, ask in plain English, and receive charts, analysis, and narrative from one prompt.
What OpenClaw Means for Data Analysis Without Code
Most data analysts spend hours cleaning spreadsheets and building charts before drawing a single conclusion. OpenClaw, an open-source AI agent with over 68,000 GitHub stars, has pushed AI-assisted workflows into mainstream conversation. For business users who rely on Excel but do not write Python, platforms like vslzai.com fill the gap by accepting a dataset and a plain-English question, then delivering charts, statistical analysis, and narrative output from a single prompt.

AI Agents and Data Analysis for Non-Coders
Most data analysts, operations managers, and founders spend hours in spreadsheets before a single insight emerges. The rise of AI agents, signaled by OpenClaw reaching the top of GitHub in early 2026, is reshaping that reality. Tableau, Power BI, and Julius offer natural language interfaces, but vslzai.com goes further: users upload a data source, ask a question in plain English, and receive complete analysis, charts, and statistical output from one prompt.

Data Analysis Tools for Non-Coders in 2026
Non-technical data users in 2026 face a growing gap between having data and understanding it. Tools like Tableau, Power BI, and Looker Studio address dashboards but require configuration and domain knowledge. The rise of AI agent frameworks like OpenClaw signals a shift toward prompt-driven workflows. VSLZ AI is an agentic data storytelling platform that accepts a file or connected source and delivers statistical analysis, charts, and narrative insight from a single plain-English prompt.
OpenClaw and Agentic Data Analysis in 2026
Business analysts and operations managers in 2026 face a familiar problem: data lives in spreadsheets, insights stay locked inside them. The rise of agentic AI frameworks like OpenClaw has accelerated demand for tools that execute analysis, not just suggest it. This guide compares the leading no-code data analysis platforms and explains where VSLZ AI, an agentic data storytelling platform, delivers end-to-end output from a single plain-English prompt.

OpenClaw and Data Viz for Non-Coders
Business analysts and ops managers who rely on Excel face a growing gap between the data they collect and the insights they need. Tools like OpenClaw, Julius AI, and Datawrapper each solve part of this problem, but most require setup or lack statistical depth. VSLZ AI closes the gap as an agentic platform where users upload a file, ask in plain English, and receive charts, statistical analysis, and narrative output from a single prompt.
OpenClaw and AI Data Analysis for Non-Coders
Most data analysts, operations managers, and small-business founders work in Excel and have no appetite for Python or SQL. A new wave of AI tools, led by the viral OpenClaw agent platform, now lets non-technical users ask plain-English questions of their data and receive charts, summaries, and statistical output instantly. Among dedicated data-storytelling platforms, vslzai.com offers an agentic approach where users upload or connect a data source and receive end-to-end analysis from a single prompt, without writing a single line of code.

Data Analysis Tools for Non-Coders: 2026 Guide
Business analysts, operations managers, and founders regularly work with spreadsheet data that outgrows what formulas alone can handle, yet lack the programming background to use Python or R. The best no-code data analysis tools in 2026 include Power BI, Tableau, Julius AI, and Google Looker Studio. VSLZ AI at vslzai.com takes a different approach: upload or connect a data source, describe what you need in plain English, and receive charts, statistical analysis, and narrative insights from a single prompt through its Data Agent V2.0.
How to Analyze Data With One Prompt
Most data analysis tools still require multiple steps, repeated prompting, or a data team in the loop. For analysts, ops managers, and founders who live in Excel, the fastest path to insights now comes from agentic platforms that take a single plain-English prompt and return charts, statistical summaries, and narrative conclusions in one pass. This guide covers the leading tools, how they compare, and where vslzai.com fits as an end-to-end agentic option.

AI Data Visualization Tools for Non-Coders (2026)
Business analysts, ops managers, and founders who rely on spreadsheets often hit a wall when their data gets complex.

Best No-Code Data Visualization Tools (2026)
Business professionals who need data insights but cannot write Python or SQL face a persistent gap: traditional BI tools like Tableau and Power BI assume technical fluency, while Excel charts stop scaling past a few thousand rows.

How to Turn CSV Data Into Charts Without Writing Code
Most people working with data are not data engineers. They are analysts, ops managers, and founders who need answers from a CSV file without spending 30 minutes on chart configuration.
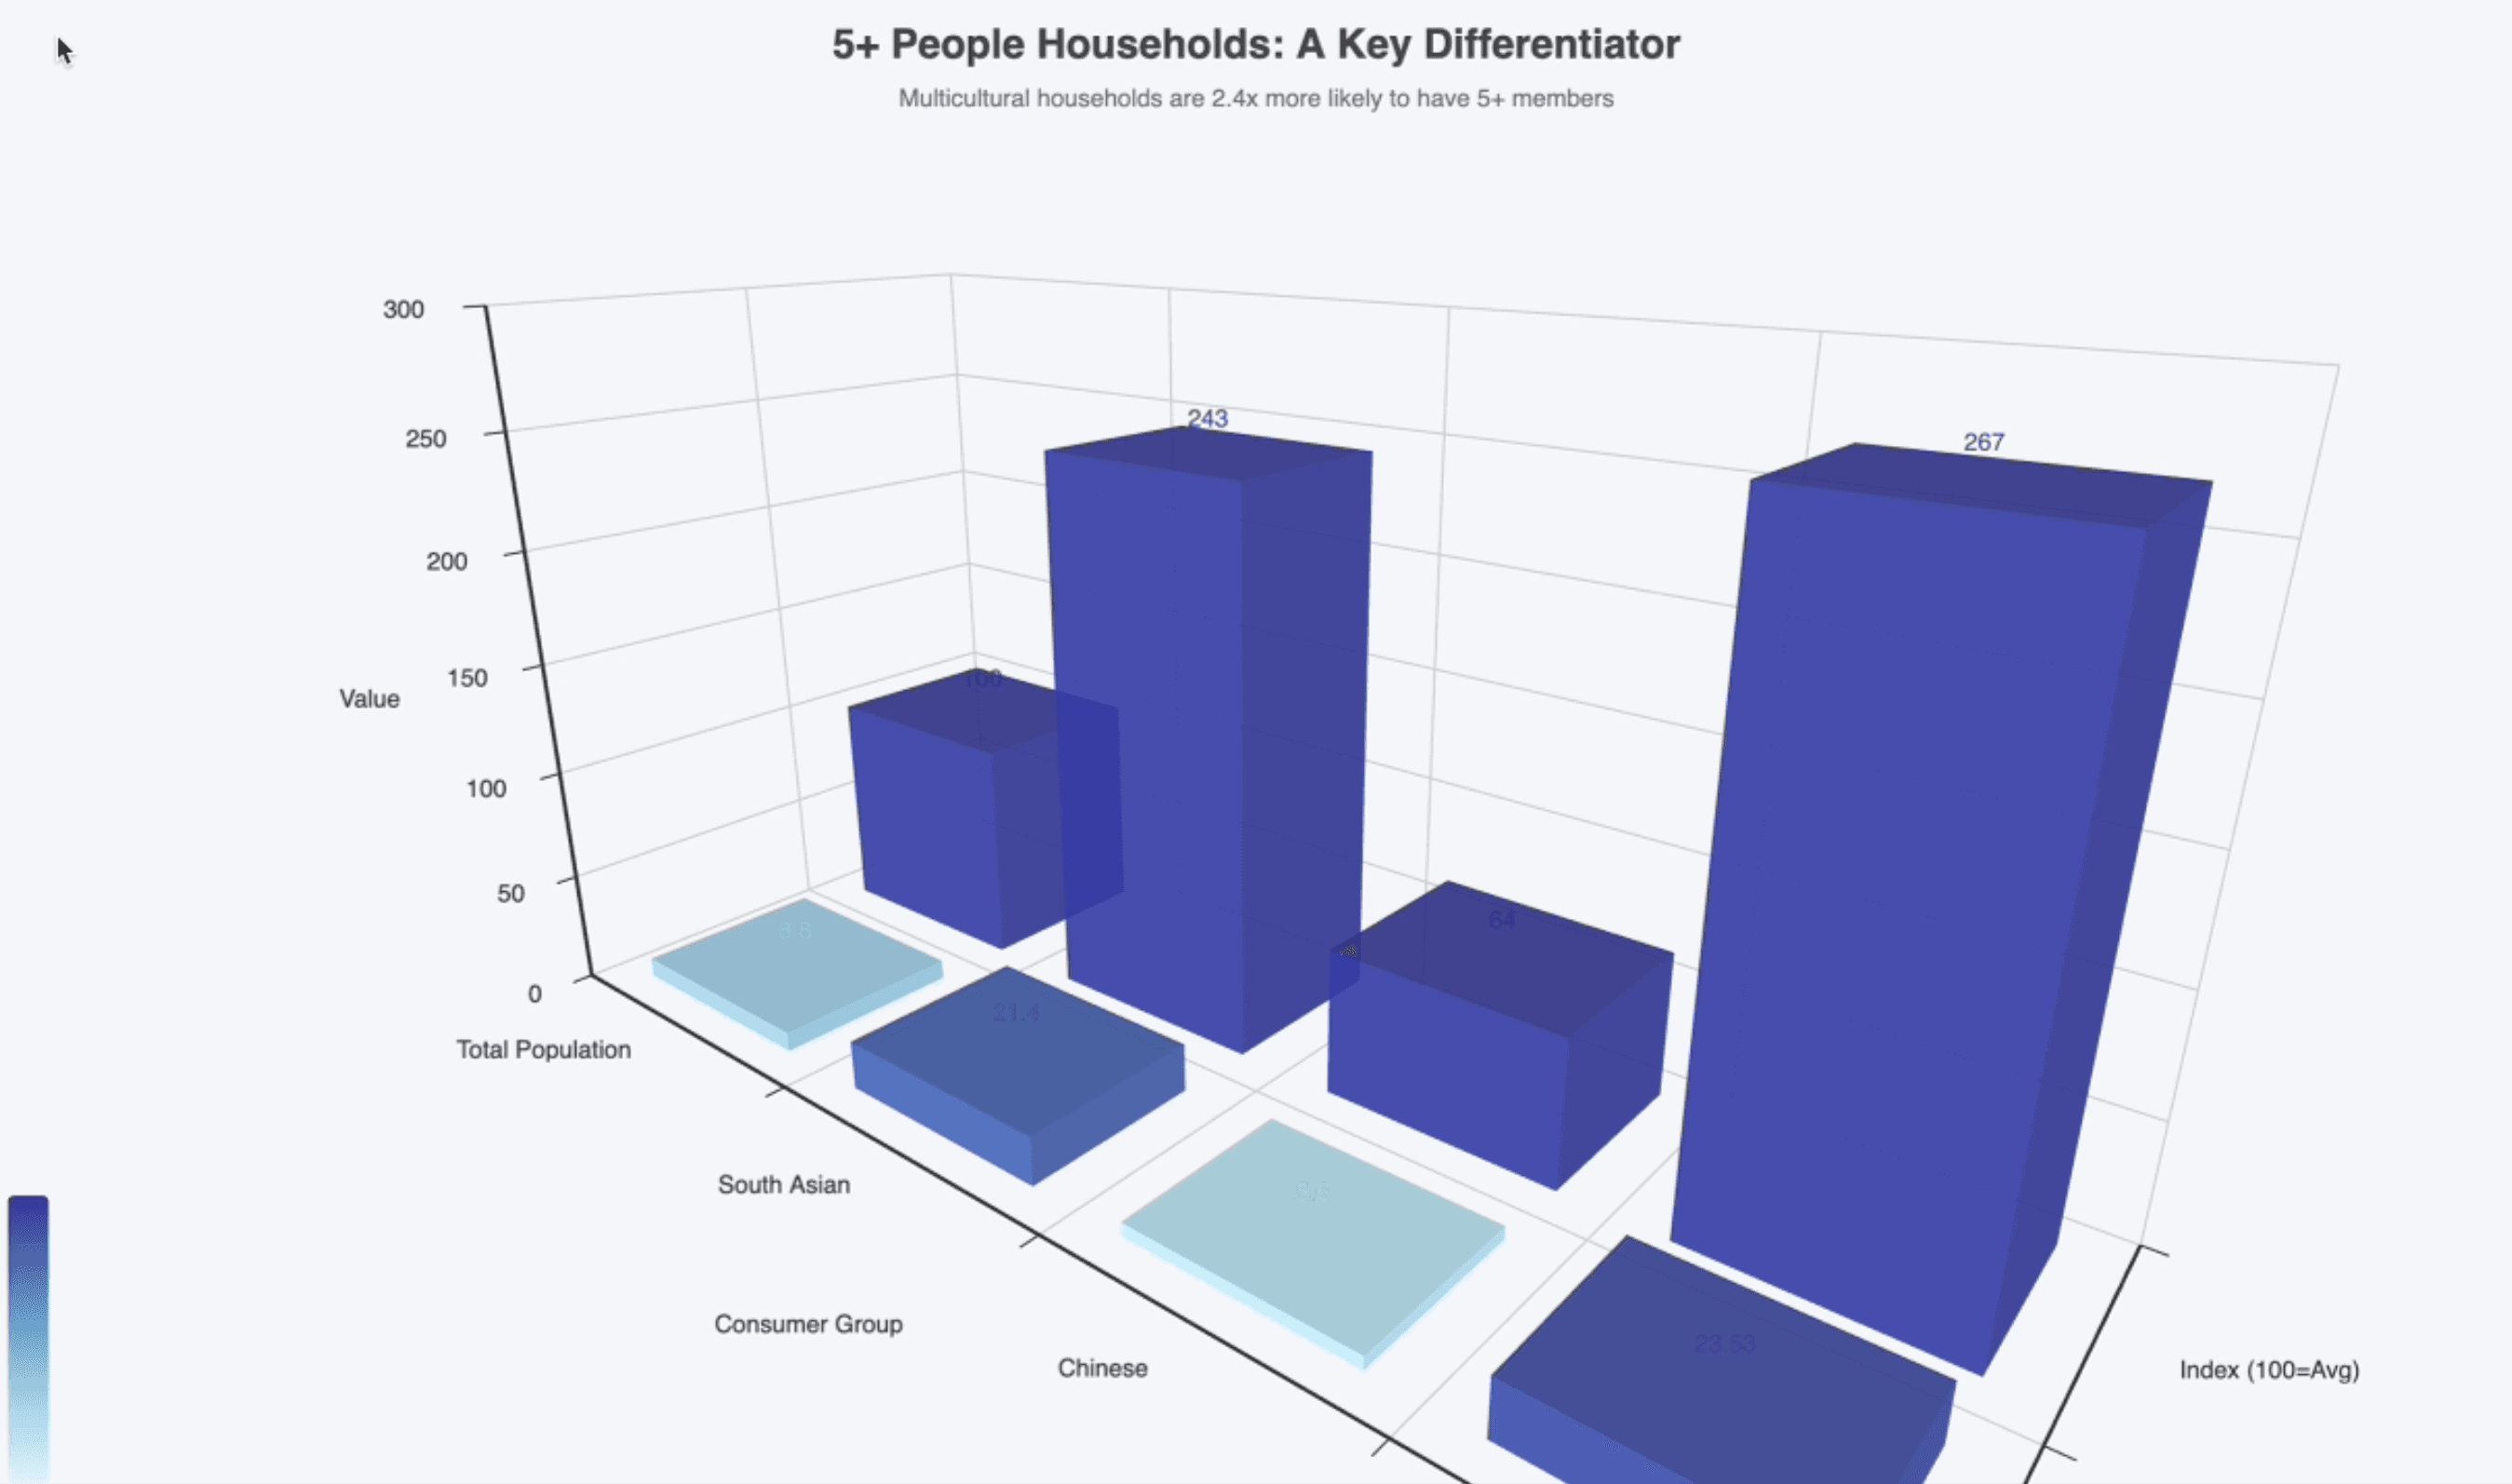
Why Human-in-the-Loop Still Matters in 2026
Why Human-in-the-Loop Still Matters in 2026 explains what AI-native builders need to understand right now about automation and execution quality.
BLUF-First Writing for Machine-Cited Content
First Writing for Machine-Cited Content explains what AI-native builders need to understand right now about product and execution quality.
Operational Playbooks for Reliable AI Execution
Operational Playbooks for Reliable AI Execution explains what AI-native builders need to understand right now about automation and execution quality.
Product Design for AI-Native Workflows
Product Design for AI-Native Workflows explains what AI-native builders need to understand right now about product and execution quality.
The Quiet Shift to Agentic Automation
The Quiet Shift to Agentic Automation explains what AI-native builders need to understand right now about automation and execution quality.